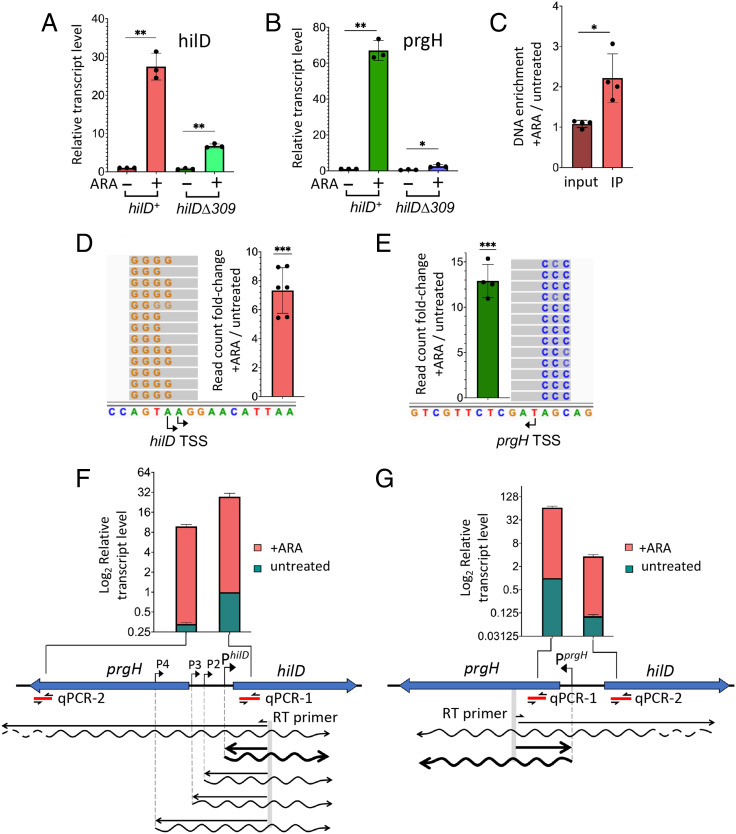
Fig. 2.
NusG depletion induces HilD-dependent activation of hilD and prgH promoters. (A and B) Quantification of hilD mRNA (A) and prgH mRNA (B) from strains MA14302 (hilD+) and MA14561 (hilDΔ309) grown to early stationary phase in the absence or in the presence of 0.1% ARA. RNA was quantified by two-step RT-qPCR. Ct values were normalized to the Ct values determined for ompA mRNA. Transcript levels are shown relative to those of untreated MA14302, set as 1. (C) Measurement of HilD protein binding to the hilD promoter. HilD-bound DNA was isolated by ChIP from strain MA14363 (carrying a chromosomal hilD-3xFLAG fusion) and quantified by real-time PCR (ChIP-qPCR). Ct values were normalized to the values of a katE gene reference. Results are presented as ratios between the values measured in cells grown in ARA-supplemented medium and the values from untreated cells. (D and E) The 5′ RACE-Seq analysis of hilD and prgH promoter activity, respectively. RNA from strain MA14302 was reverse-transcribed in the presence of a TSO. The resulting cDNA was used as template for semiquantitative PCR with primers carrying Illumina adapter sequences at their 5′ ends. Amplified DNA was subjected to high-throughput sequencing. Read counts were normalized to those measured at the ompA promoter. Results shown represent the ratios between the normalized counts from ARA-treated cells and those from untreated cells. (F and G) Contribution of distal transcription to hilD and prgH RNA levels, respectively. RNA was reverse-transcribed with primers annealing inside the promoter-proximal portion of hilD or prgH (predicted transcripts are depicted as wavy lines). The resulting cDNAs (straight lines) were used for qPCR amplification with primers annealing close to (qPCR-1) or farther away from (qPCR-2) the RT priming site. Ct values were normalized to the Ct values determined for ompA mRNA. Transcript levels are shown relative to those of untreated MA14302 cells, set as 1. All the data in this figure originate from three or more independent experiments (with error bars indicating SDs). Statistical significance was determined by unpaired two-tailed Student t tests with Welch’s correction for unequal variances (*P ≤ 0.05; **P ≤ 0.01; ***P ≤ 0.001). In F and G, the calculated P values for the differences between untreated samples (green bars) were 0.0002 (F) and <0.0001 (G). The P values for the ARA-treated samples (red bars) were 0.0108 (F) and 0.0025 (G). The oligonucleotides used as primers in the above experiments are listed in SI Appendix, Table S4. Further experimental details are provided in Materials and Methods.

