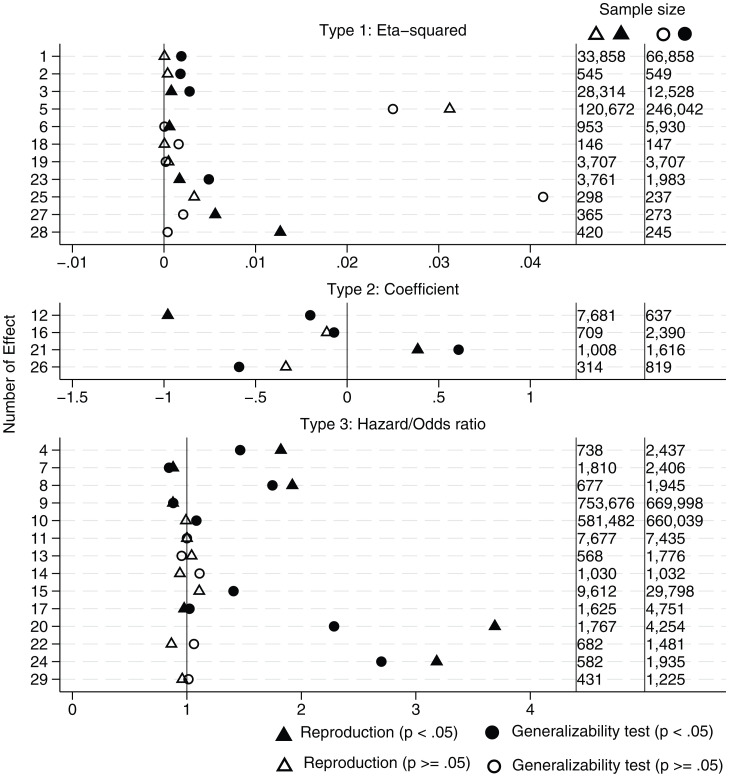
Fig. 1.
Reproductions and generalizability tests for 29 strategic management findings. Results of the generalizability tests initiative are presented separately by type of effect size estimate (eta square, coefficient, hazard or odds ratio). The leftmost column is the numeric indicator for the original finding (1 to 29) (Table 1 has detailed descriptions). The central column depicts the effect size estimates for the reproductions (same data, same analysis) and generalizability tests (different time period and/or geography, same analysis). Generalizability test estimates are based on pooled data across all new tests. Triangles (reproductions) and circles (generalizability tests) are a solid color if the effect was statistically significant at P < 0.05. Findings 25 to 29 were nonsignificant in the original report. The two rightmost columns display the sample sizes for each analysis.

