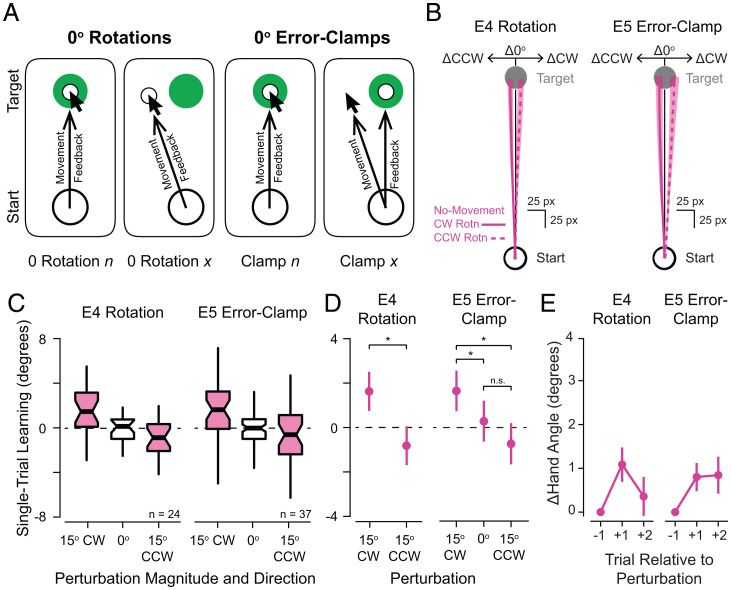
Fig. 3.
Effects of simulated errors when perturbations were never applied during movement trials. (A) Schematic illustrating the relationship between movement and visual FB on movement trials during experiments 4 and 5 where nonzero visuomotor rotations (Left) or error clamps (Right) were never applied during movement trials. (B) Example participant’s mean ± SEM changes in reach paths across no-movement triplets from studies in which nonzero rotations (Left, experiment 4) and error clamps (Right, experiment 5) were never applied (solid lines, perturbation was CW; dashed lines, perturbation was CCW). (C) Boxplots showing STL in response to different directions of simulated errors (no-movement triplets indicated in magenta) from rotation (Left, experiment 4, n = 24) and error-clamp (Right, experiment 5, n = 37) studies. (D) Estimated marginal means ± 95% confidence intervals from the LMMs fit to each participant’s STL performance summarized in C. Asterisks indicate statistically significant differences. (E) Mean ± SEM relative hand angles on the two trials after a perturbation was presented on a no-movement trial (Left, experiment 4; Right, experiment 5). Refer to SI Appendix, Table S3 for detailed statistical results. Boxplot centers, median; notches, 95% confidence interval of the median; box edges, first and third quartiles; whiskers, most extreme values within 1.5*inter-quartile range (IQR) of the median. Statistical significance (* = Padj < 0.05; n.s. = Padj ≥ 0.05) is indicated for selected comparisons. Δ, change in; E, experiment; n.s., not significant.

