Fig. 1.
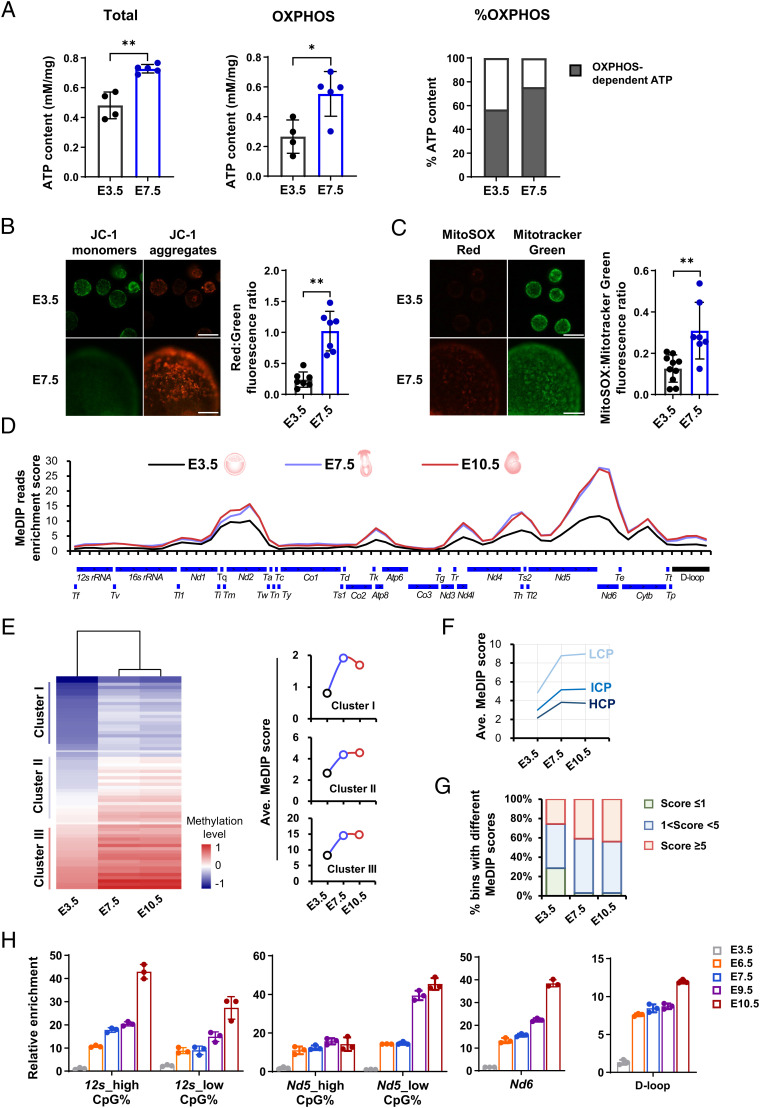
Spatiotemporal coincidence of de novo mtDNA methylation and mitochondrial oxidative stress during the peri-implantation window. (A) Comparisons of total ATP levels (Left), as well as OXPHOS-dependent ATP production (Middle) and relative contributions (Right) between E3.5 and E7.5 embryos. (B) Mitochondrial membrane potential in E3.5 and E7.5 embryo. Right: mitochondrial membrane potential by quantifying ratios of red (JC-1 aggregates): green (JC-1 monomer) fluorescence. (Scale bar: 100 μm.) (C) Fluorescent images of intramitochondrial ROS in E3.5 and E7.5 embryos detected by MitoSOX, a mitochondria-specific probe. Right: quantification of intramitochondrial ROS levels. (Scale bar: 100 μm.) (D) Methylation profiles of linearized mtDNA detected using MeDIP-seq across the mouse mitochondrial genome in E3.5, E7.5, and E10.5 embryos. The y axis shows the normalized enrichment of MeDIP-reads in each bin of 500 bp. The annotations below the linearized mtDNA map show the positions of mtDNA elements. (E) Heatmap analysis of all bins of the mitochondrial genome based on their MeDIP enrichment scores at three developmental stages. Right: mtDNA methylation dynamics of three subcategories of bins with different average enrichment scores at E3.5. (F) mtDNA methylation dynamics of three subcategories of bins with relatively high (≥ 2.6%, HCP), intermediate (> 1.2% and < 2.6%, ICP) or low (≤ 1.2%, LCP) CpG density. (G) Fraction of enriched bins with different enrichment scores at three developmental stages. (H) Relative methylation levels detected using MeDIP-qPCR in selected regions during consecutive developmental stages of peri-implantation, including the heavy- and light-strand protein coding gene (Nd5, Nd6), the noncoding gene (12s), and the control region (D-loop) at consecutive developmental stages. Data are presented as the mean ± SD of three independent experiments. *P < 0.05, **P < 0.01.

