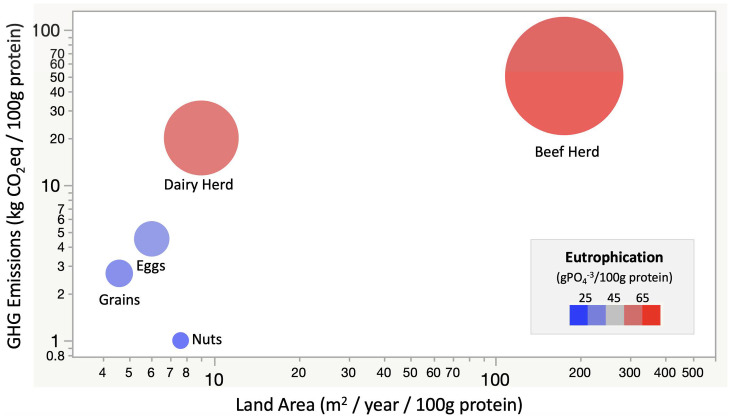
Fig. 1.
Land area (x axis) and greenhouse gas emissions (y axis) normalized to per mass of protein yield for different agricultural land uses. Circle size = CO2 equivalents per 100 g protein. Color gradient = nutrient requirement per 100 g protein. Average values adapted from ref. 2.

