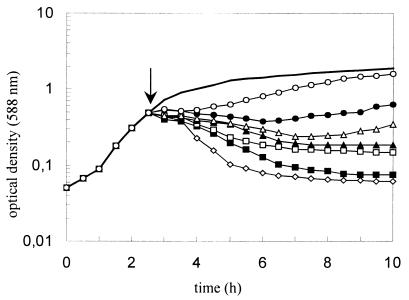
FIG. 5.
Inhibition of Y. enterocolitica 13169 after addition of enterocoliticin (↓) at final concentrations of (⋄) 2.2 × 10⁴ AU ml−1, (▪) 1.1 × 10⁴ AU ml−1, (□) 5.5 × 10³ AU ml−1, (▴) 2.6 × 10³ AU ml−1, (▵) 1.3 × 10³ AU ml−1, (●) 0.7 × 10³ AU ml−1, and (○) 0.3 × 10³ AU ml−1. Solid curve shows the untreated control. The experiment was repeated twice with similar results.

