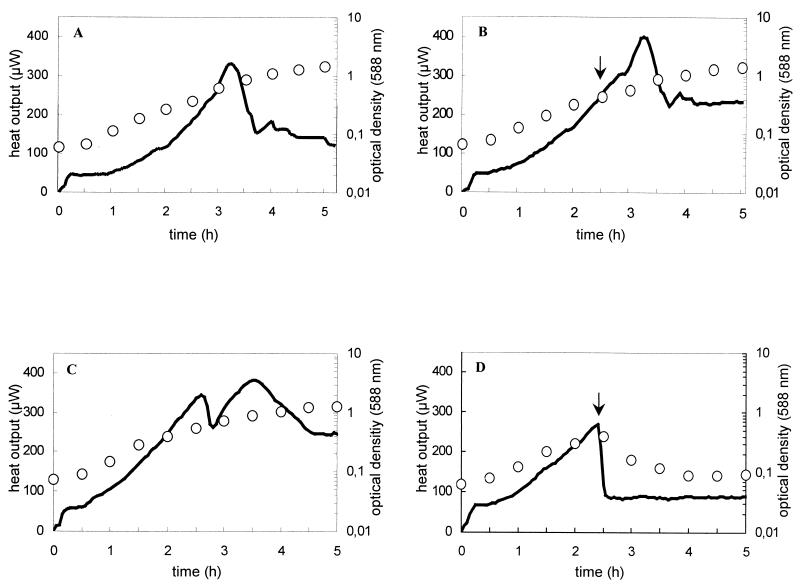
FIG. 6.
Thermograms and growth curves of Y. enterocolitica 29807 (A and B) and Y. enterocolitica 13169 (C and D) without (A and C) and with addition of enterocoliticin at a final concentration of 4.4 × 10⁴ AU ml−1(B and D). Solid lines show the recorded heat output of the bacterial suspension, and open symbols depict the growth of the culture (OD588). Arrows indicate the time point of addition of enterocoliticin. The experiments shown in A, B, and C were repeated once and the experiment shown in D was repeated twice with similar results.

