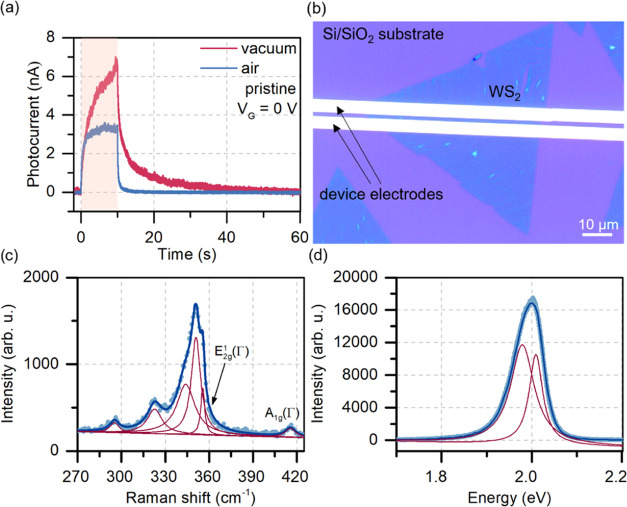
Figure 1.
Initial characterization of the as-prepared WS2 sample. (a) Time-resolved photocurrent signal of the pristine WS2 sample in vacuum and air. The highlighted area corresponds to the time the device was illuminated. (b) Optical image showing the measured device. The channel was 2 μm long. (c, d) Raman spectrum (c) and photoluminescence spectrum (d) of the WS2 untreated sample were measured with a 532 nm laser. The spectra show the fitted Lorentzian functions for the specific peaks (red curves).

