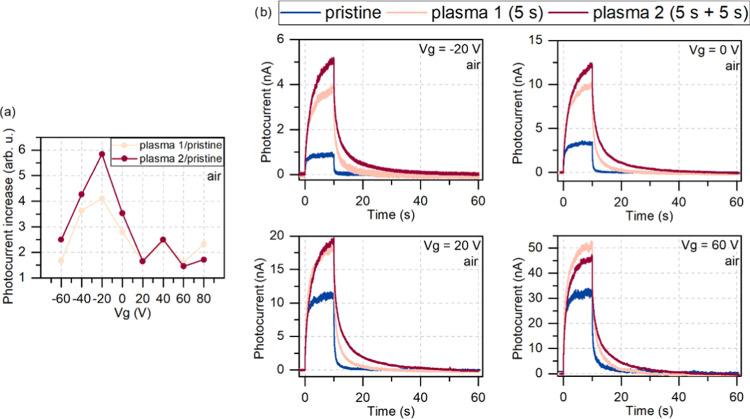
Figure 3.
Comparison of the photocurrent measured in air for treated and untreated samples. (a) Photocurrent increase calculated as a maximum photocurrent obtained after the same amount of time for each gate voltage and normalized by the maximum photocurrent of the pristine sample in air. (b) The photocurrent signal of the samples before (pristine—blue lines) and after plasma treatment (first plasma—beige lines, second plasma—red lines) measured in air. The graphs show the gate voltage dependence of the photocurrent for −20, 0, 20, and 60 V. The photocurrent signal shows a stronger dependence on the applied voltage in air, where the dominating signal changes between the second and first plasma treatments. The highest photocurrent enhancement was observed for low gate voltages after two plasma processes. Still, with a high gate voltage applied, the first plasma treatment yields the best results in increasing the signal (here at 60 V).

