Figure 4.
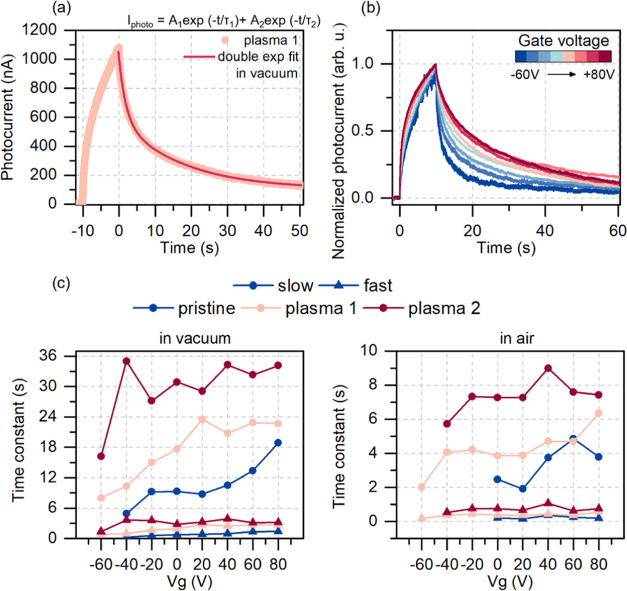
Relaxation time dependence on the gate voltage. (a) The result of fitting a double exponential function to the photocurrent decay signal of the plasma-treated sample. (b) Normalized photocurrent signal of the sample after the first plasma treatment in vacuum showing the effect of the applied gate voltage on the photocurrent relaxation in the sample. The lower the gate voltage applied, the faster the relaxation. This effect is attributed to the occupancy of the recombination centers in the band gap. (c) The slow and fast photoresponse time constants for each sample resulting from the double exponential fit in (a). The slow component shows a stronger dependence on the applied gate voltage. The significant noise for the untreated sample at low voltages in air resulted in the inability to perform the fit and therefore missing points in the plot.

