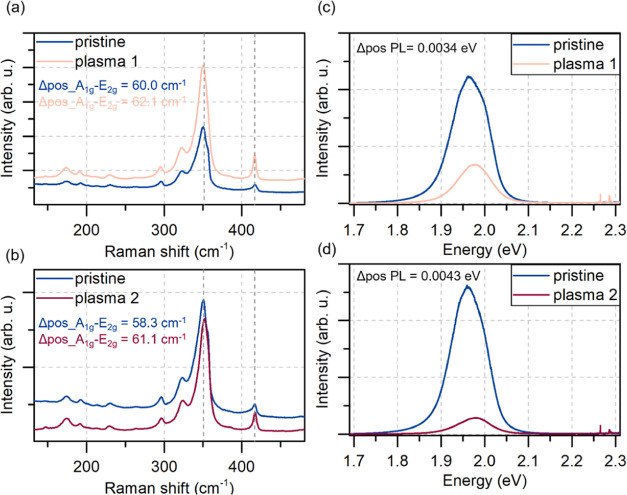
Figure 5.
Raman and photoluminescence spectroscopy results. (a, b) Raman spectra of the untreated (pristine) and plasma-treated samples of WS2 (one plasma process—a, two plasma processes—b). The treatment of the samples resulted in the asymmetric shift of the two main peaks (upshift of A1g, downshift of E12g), changing the difference in peaks’ positions (Δpos A1g–E2g). (c, d) Photoluminescence spectra of WS2 untreated and treated samples. The plasma treatment resulted in the signal quenching and the blue shift of the peaks by Δpos PL = 0.0034 eV (c) after the first plasma process and 0.0043 eV (d) after the second plasma process. The position of the peak was calculated as the mean value of the two fitted Lorentzian curves.

