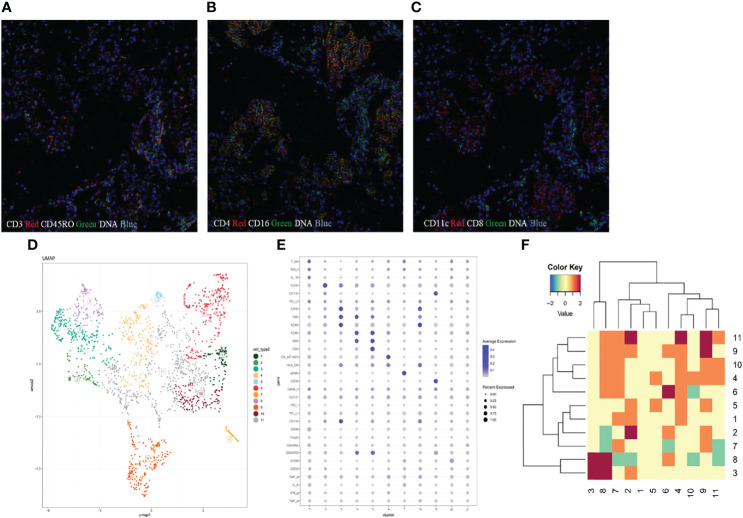
Figure 4.
The microenvironment in patients with immune checkpoint inhibitor-related pneumonitis. (A–C) Imaging mass cytometry (IMC) imaging of formalin-fixed paraffin-embedded lung tissue specimen. (D) Statistical t-distributed stochastic neighbor embedding (tSNE) plots were generated to divide the cell populations into 11 clusters according to phenotypic similarity. (E) Heat map analysis of the mean expression of analyzed markers from 11 identified clusters. The expression levels are indicated by heat colors. (F) Neighborhood analysis revealed cell-to-cell interactions between different clusters.

