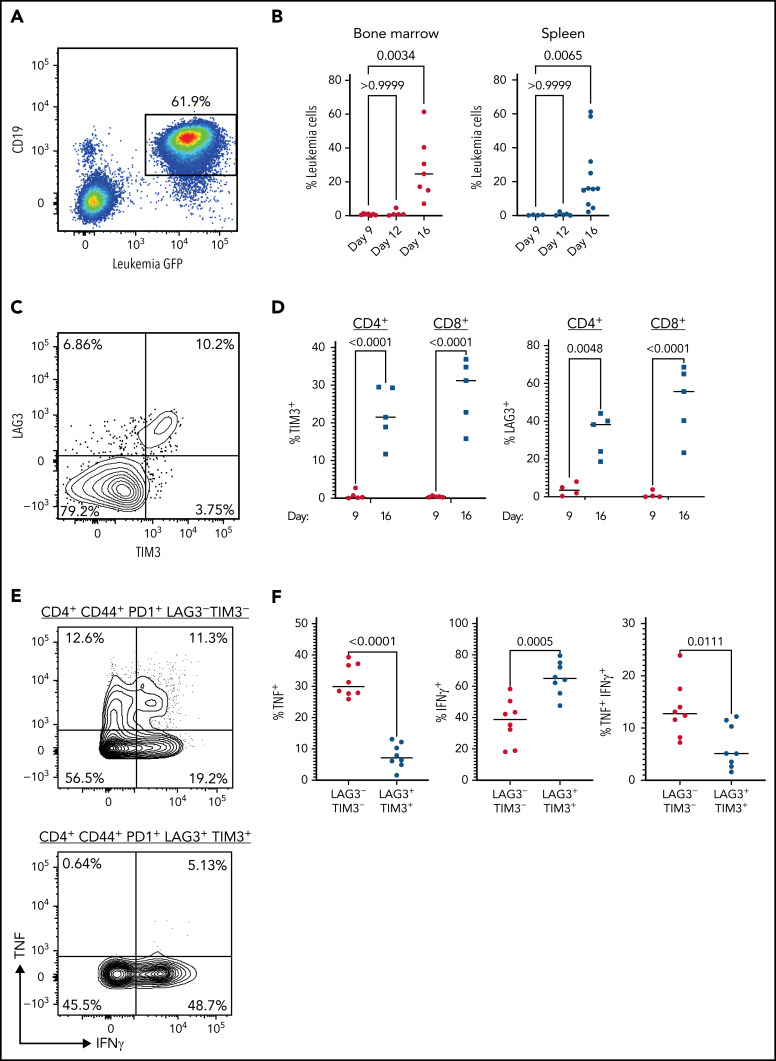
Figure 1.
Leukemia induces an exhaustion phenotype in activated T cells. (A) CD45.2+ mice were injected with 2500 CD45.1+ LM138 leukemia cells. A representative flow plot of CD19+GFP+ leukemic cells in the spleen from mice at day 16 after injection is shown. (B) Percent leukemia cells in bone marrow (left panel) and spleen (right panel) at days 9, 12, and 16 (n = 7 per timepoint from 2 independent experiments). Median is displayed, P values determined by Kruskal-Wallis test. (C) A representative example of LAG3 and TIM3 expression on CD4+ T cells from mice injected with 2500 leukemia cells and harvested 16 days later. (D) Percent of TIM3+ (left panel) or LAG3+ (right panel) CD4+ and CD8+ T cells at days 9 and 16 after injection with 2500 leukemia cells. Median is displayed (n = 5 per time point from 2 independent experiments). P value determined by 2-way analysis of variance. (E) Mice were injected with 2500 leukemia cells and CD4+ T cells harvested 16 days later. Shown is a representative example of TNF and IFN-γ expression in CD4+CD44+PD1+LAG3−TIM3− and CD4+CD44+PD1+LAG3+TIM3+ splenocytes after in vitro stimulation with PMA and ionomycin. (F) Percent of CD4+ T cells expressing TNF (left panel), IFN-γ (middle panel), and both cytokines (right panel) after in vitro stimulation as in E. Median values are shown (n = 8 from 2 independent experiments). P values determined by unpaired t-test.

