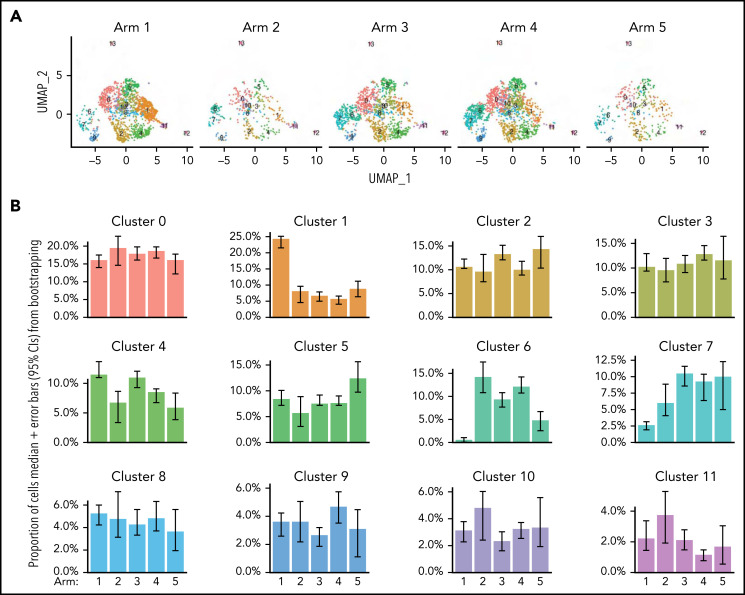
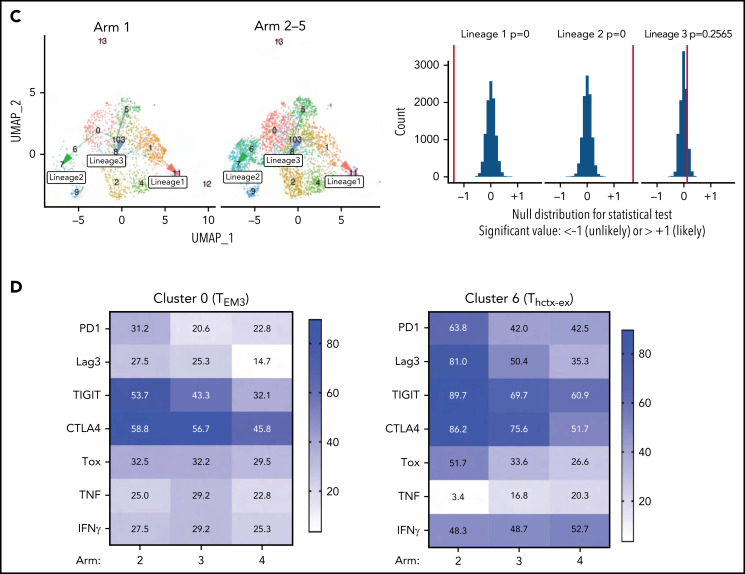
Figure 5.
Leukemia induces a unique T-helper/cytotoxic subset that is impacted by nilotinib and anti–PD-L1. (A) UMAP plots showing the CD4+ T-cell subsets stratified by treatment arm. The number of cells in each arm is as follows: n = 1591 cells for arm 1; n = 417 cells for arm 2; n = 1290 cells for arm 3; n = 1692 cells for arm 4; and n = 359 cells for arm 5. (B) Plots showing the proportion of cells in each cluster that came from each treatment arm. Error bars represent 95% confidence intervals generated using a bootstrapping approach. (C) UMAP plots (left) showing the trajectory relationships between clusters via slingshot, stratified by either CD4+ T cells from arm 1 (heat-killed leukemia immunized mice) or arms 2 to 5 (mice with live leukemia). Histogram (right) of permutation test statistics under the null hypothesis (gray bars) and the initial test statistic (red line). Test statistics were calculated as the difference in means of lineage-weighted pseudotime values between CD4+ T cells from arms 2 to 5 (mice with live leukemia) following lineages 1, 2, or 3, relative to CD4+ T cells from arm 1 (heat-killed leukemia). (D) Heat maps showing the proportion of CD4+ T cells in the indicated cluster from the respective treatment arms that express the indicated gene.


