Figure 6.
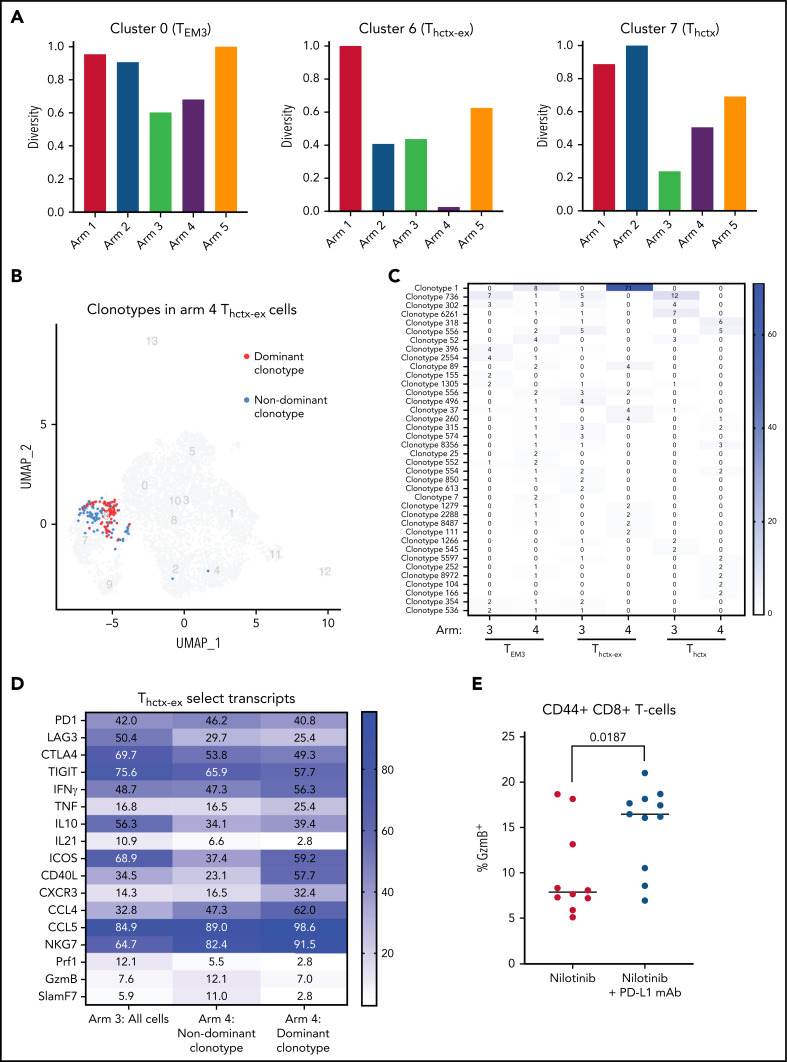
PD-L1 blockade is associated with an expansion of a dominant CD4+ Thctx clone. (A) TCR diversity (Inverse Simpson’s coefficient) in the T cells from clusters 0, 6, and 7 stratified by treatment arm. (B) UMAP plot showing the dominant clonotype (red; n = 71 cells) vs other T cells (blue; n = 91 cells) in cluster 6 of nilotinib plus PD-L1 mAb-treated mice (arm 4). (C) Heatmap showing the numerical representation of the expanded T-cell clones present in the indicated clusters from mice treated with nilotinib plus isotype (arm 3) or nilotinib plus PD-L1 blockade (arm 4). An expanded clone was defined as one that had more than 2 cells present in at least 1 cluster from 1 treatment arm. Each box represents the number of T cells in the indicated treatment arm that belongs to the indicated T-cell clone. (D) A heatmap showing the proportion of the dominant clonotype T cells expressing the indicated genes, relative to other T cells in cluster 6 of nilotinib plus anti–PD-L1–treated mice (arm 4) or T cells in cluster 6 of nilotinib plus isotype-treated mice (arm 3). (E) Flow plots and graphs showing the proportion of GZMB+CD8+ T cells in mice treated with nilotinib and PD-L1 blockade or nilotinib and an isotype control antibody. Mice were analyzed 1 day after completion of treatment with nilotinib +/− PD-L1 blockade. The median is displayed, and statistical significance was determined using an unpaired t-test (n = 10 mice per treatment arm; results represent 2 independent experiments).

