Figure 7.
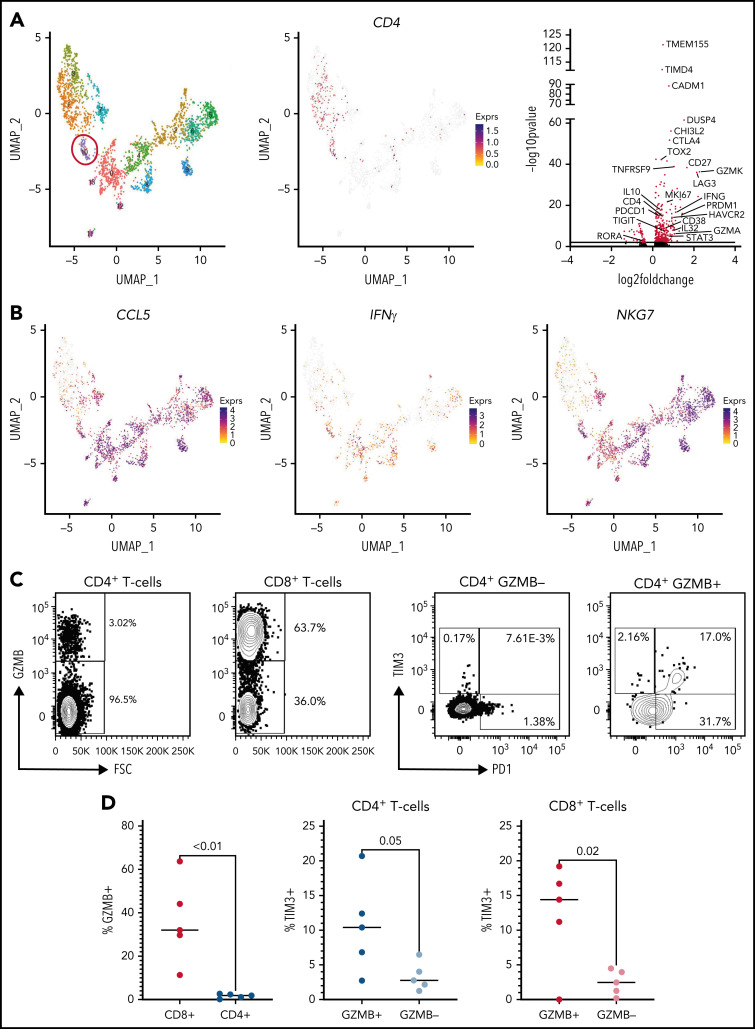
Helper/cytotoxic exhausted CD4+ T cells are observed in human patients with B-ALL. (A) UMAP plot of CD3+ T cells sorted from diagnostic bone marrow biopsy samples of 5 patients with B-ALL. A population of CD4+ T cells expressing markers of cytotoxicity was identified (red circle; left panel). Feature plot showing CD4 expression (middle panel). The volcano plot illustrates significantly differentially expressed genes between this cluster (n = 69 cells) as compared with all others (n = 2442 cells); transcripts identified with a false discovery rate (FDR) >2 are highlighted in red (right panel). (B) Feature plots showing expression of CD4, CCL5, IFNG, and NKG7. (C) Representative plots using flow cytometry to profile the frequency of GZMB+ cells between CD4+ and CD8+ T cells (left panels) and the relative distribution of TIM3 positivity in either GZMB− or GZMB+ cells (right panels). (D) Graphs showing the frequency of GZMB+ cells in CD4+ and CD8+ T cells and the relative distribution of TIM3+ events in either GZMB− or GZMB+ cells. The median is displayed, and statistical significance was determined using an unpaired t-test. The data from diagnostic samples from 5 patients are summarized.

