Figure 4.
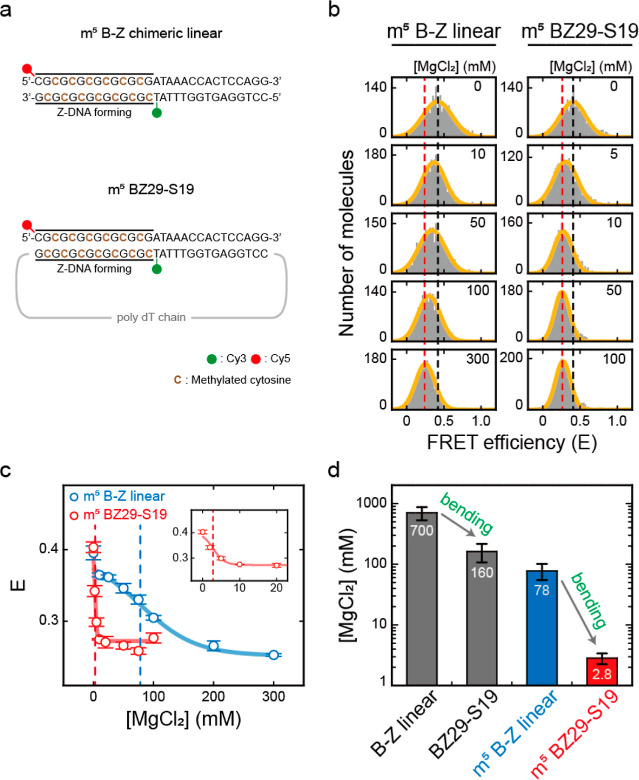
Effects of DNA bending on the B–Z transitions of methylated (indicated by m5) DNAs. (a) DNA sequences used for the B–Z transition experiments. Methylated cytosines are indicated in brown color. (b) FRET histograms of m5 B–Z linear and m5 BZ29-S19 samples at various concentrations of MgCl2 obtained by the ALEX method. Histograms were fitted to a single Gaussian distribution. The black dotted lines denote the E of each sample in the absence of MgCl2. The red dotted lines denote the E of each sample at the highest concentration of MgCl2 (300 mM for m5 B–Z linear and 100 mM for m5 BZ29-S19). (c) E of m5 B–Z linear and m5 BZ29-S19 samples plotted against the concentration of MgCl2. The blue dotted line denotes the midpoint of the m5 B–Z linear sample (78 mM), and the red dotted line denotes the midpoint of the m5 BZ29-S19 sample (2.8 mM). The inset graph shows the E values of the m5 BZ29-S19 sample at low salt concentrations. Error bars were obtained from three independent measurements. (d) B–Z transition midpoints of each sample (B–Z linear, BZ29-S19, m5 B–Z linear, and m5 BZ29-S19). The midpoints of the B–Z linear and BZ29-S19 samples were obtained from Figure 3c. As the bending force increases, the midpoint decreases. Error bars were obtained from three independent measurements.

