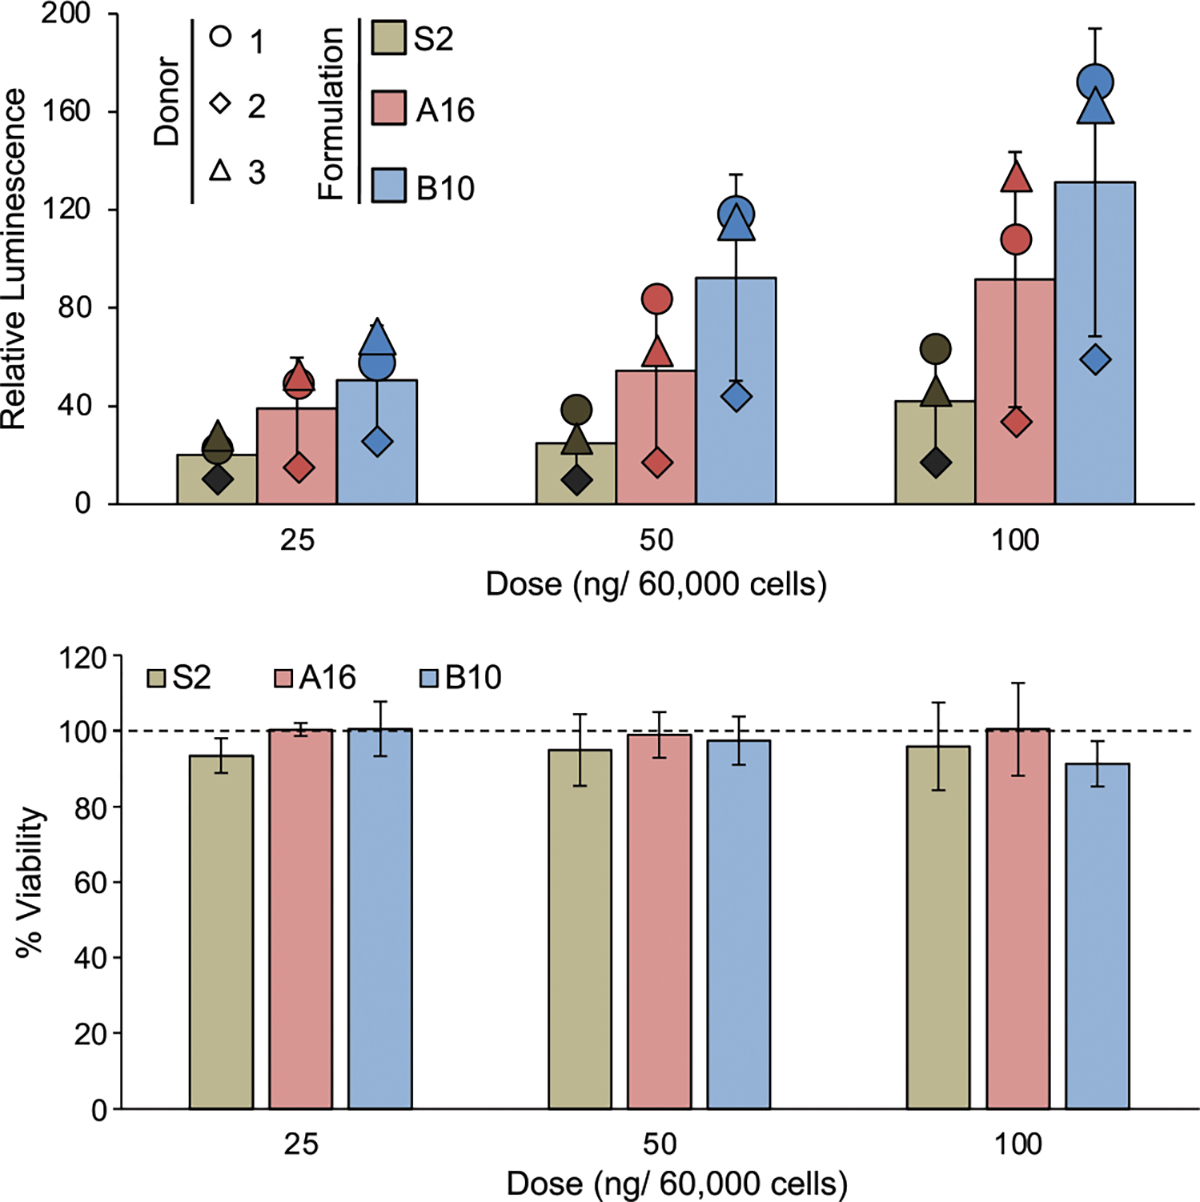
Figure 4.

Luciferase expression and viability of primary human T cells treated with S2, A16, or B10 LNPs for 24 h, confirming trends in LNP formulation performance. The bar graphs represent an average of 3 individual donors as normalized to untreated cells. To demonstrate the donor-to-donor variability, the average relative luminescence for each donor at each treatment and dose is represented as a shape. The effects of the three treatments were compared via a one-way ANOVA at each dose, but no significance was found. However, the results from each donor demonstrate the same trends observed previously with B10 resulting in the highest luminescence and S2 resulting in the lowest. n = 3 biological replicates (bar graphs), n = 3 technical replicates (points), error bars = standard deviation.
