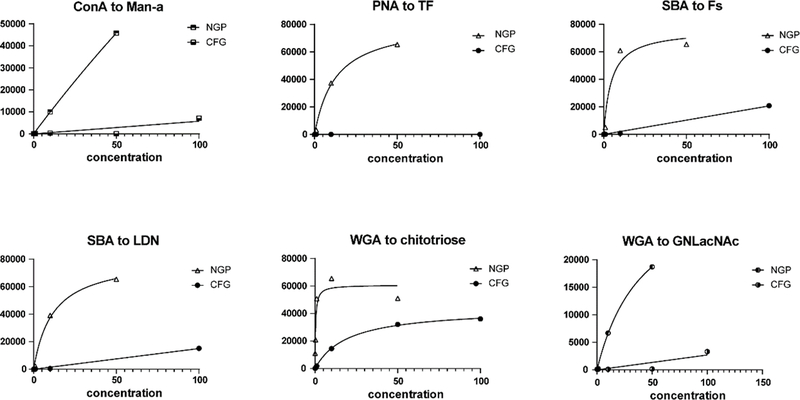
Figure 2. Examples of discrepancies between the CFG and neoglycoprotein (NGP) array.
Data are shown for 6 of the 101 instances of large discrepancies between the CFG and NGP array. Data are graphed over all measured concentrations of lectin, with lectin concentration on the x-axis and RFU on the y-axis. Abbreviations are as follows: Man-a (CFG = #3, mannose alpha linked to Sp8; NGP = #275, low density mannose alpha linked to BSA, ~5/BSA), TF [CFG = #141, Galβ1–3GalNAcα-Sp14 (threonine); NGP = #109, Ac-Ser-(Galβ1–3GalNAcα)Ser-Ser-Gly-Hex-BSA, ~16/BSA], Fs (Forssman disaccharide; CFG = #92, GalNAcα1–3GalNAcβ-Sp8; NGP = #108, GalNAcα1–3GalNAcβ-BSA), LDN (LacDiNAc; #100, GalNAcβ1–4GlcNAcβ-Sp8; NGP = #234, GalNAcβ1–4GlcNAcβ-BSA, ~16/BSA), Chitotriose (CFG = #192, GlcNAcβ1–4GlcNAcβ1–4GlcNAcβ-Sp8; NGP = #129, GlcNAcβ1–4GlcNAcβ1–4GlcNAcβ-BSA, ~20/BSA), GNLacNAc (CFG = #183, GlcNAcβ1–3Galβ1–4GlcNAcβ-Sp0; NGP = #255, GlcNAcβ1–3Galβ1–4GlcNAcβ-BSA).

