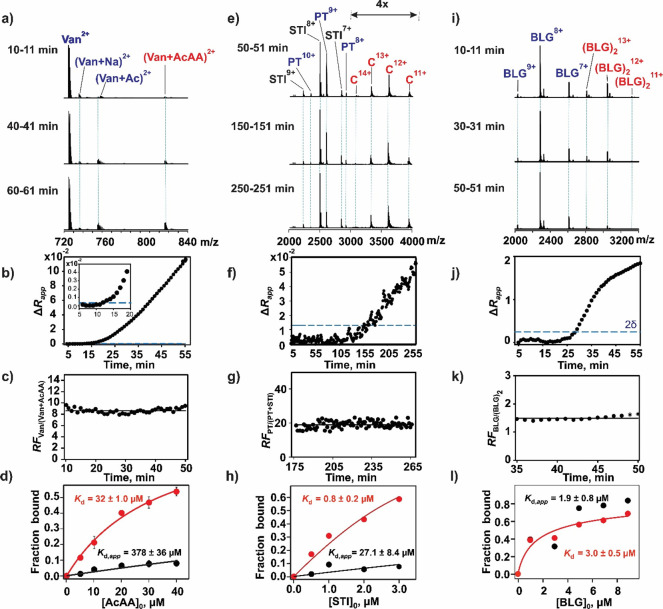
Figure 2.
Validation of SLOMO using model biomolecular interactions with known affinities (a–d) Van–AcAA, (e–h) PT–STI, and (i–l) BLG–BLG. (a) Representative ESI mass spectra acquired in the positive ion mode at three different times for a mixture of ammonium acetate (200 mM, pH 6.9) solutions: solution 1, Van (2 μM) and AcAA (10 μM); solution 2, Van (2 μM) and AcAA (500 μM). (b) Plot of time-dependent ΔRapp values. The inset shows ΔRapp values measured at early times, and the dashed line (blue) indicates two standard deviations (2δ) from the mean. (c) Plot of time-dependent relative response factors (RFVan/(Van+AcAA)) measured for Van and the Van–AcAA complex. (d) Plot of the fraction of Van bound to AcAA versus the initial AcAA concentration determined without (black circles) and with (red circles) consideration of RFVan/(Van+AcAA). Solid curves represent the best fit of eq 11 to the experimental data. (e) Representative ESI mass spectra acquired in the positive ion mode at three different times for a mixture of ammonium acetate (200 mM, pH 4.5) solutions: solution 1, PT (3 μM) and STI (0.5 μM); solution 2, PT (3 μM) and STI (30 μM). (f) Plot of time-dependent ΔRapp values. The inset shows ΔRapp values measured at early mixing times. (g) Plot of time-dependent relative response factors (RFPT/(PT+STI)) measured for PT and the PT–STI complex. (h) Plot of the fraction of PT bound to STI versus the initial STI concentration determined without (black circles) and with (red circles) consideration of RFPT/(PT+STI). Solid curves represent the best fit of eq 11 to the experimental data. (i) Representative ESI mass spectra acquired in the positive ion mode at three different times for a mixture of ammonium acetate (200 mM) solutions of BLG (3 μM): solution 1, pH 6.9; solution 2, pH 10.6. (j) Plot of time-dependent ΔRapp values. (k) Plot of time-dependent relative response factors (RFBLG/(BLG)2) measured for the BLG monomer and dimer. (l) Plot of the fraction of BLG present as the dimer versus the initial BLG (monomer) concentration (1–9 μM) measured without (black circles) and with (red circles) consideration of RFM/D. Solid curves represent the best fit of eq 17 to the experimental data.

