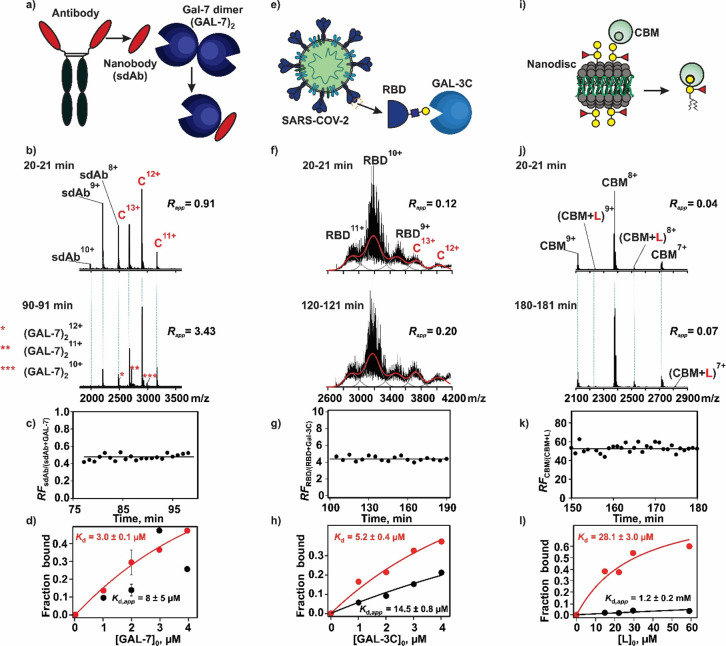
Figure 3.
Applications of SLOMO to the following lectin interactions: (a–d) GAL-7 with sdAb, (e–h) GAL-3C with SARS-CoV-2 RBD glycoprotein, and (i–l) CBM with glycolipid (B-triNGL) presented in a nanodisc (ND) model membrane. (b) Representative ESI mass spectra acquired in the positive ion mode at two different times for a mixture of ammonium acetate (200 mM, pH 7.4) solutions: solution 1, sdAb (3 μM) and GAL-7 (3 μM); solution 2, sdAb (3 μM) and GAL-7 (40 μM). (c) Plot of time-dependent relative response factors (RFsdAb/(sdAb+GAL-7)) measured for sdAb and the sdAb–GAL-7 monomer complex. (d) Fraction of sdAb bound to GAL-7 plotted as a function of the initial GAL-7 (monomer) concentration determined without (black circles) and with (red circles) consideration of RFsdAb/(sdAb+GAL-7). Solid curves represent the best fit of eq 11 to the experimental data. (f) Representative ESI mass spectra acquired in the positive ion mode at two different times for a mixture of ammonium acetate (200 mM, pH 7.4) solutions: solution 1, RBD (4 μM) and GAL-3C (2 μM); solution 2, RBD (4 μM) and GAL-3C (25 μM). (g) Plot of time-dependent relative response factors (RFRBD/(RBD+GAL-3C)) measured for RBD and the RBD–GAL-3C complex. (h) Fraction of RBD bound to GAL-3C RBD plotted as a function of the initial GAL-3C concentration determined without (black circles) and with (red circles) consideration of RFRBD/(RBD+GAL-3C). Solid curves represent the best fit of eq 11 to the experimental data. (j) Representative ESI mass spectra acquired in the positive ion mode at two different times for a mixture of ammonium acetate (200 mM, pH 6.9) solutions: solution 1, CBM (5 μM) and a ND containing B-triNGL (1 μM ND and 30 μM B-triNGL ≡ L); solution 2, CBM (5 μM) and a ND containing B-triNGL (10 μM ND and 300 μM B-triNGL). (k) Plot of time-dependent relative response factors (RFCBM/(CBM+L)) measured for CBM and the CBM–L complex. (l) Fraction of CBM bound to B-triNGL plotted as a function of the initial B-triNGL concentration determined without (black circles) and with (red circles) consideration of RFCBM/(CBM+L). Solid curves represent the best fit of eq 11 to the experimental data.

