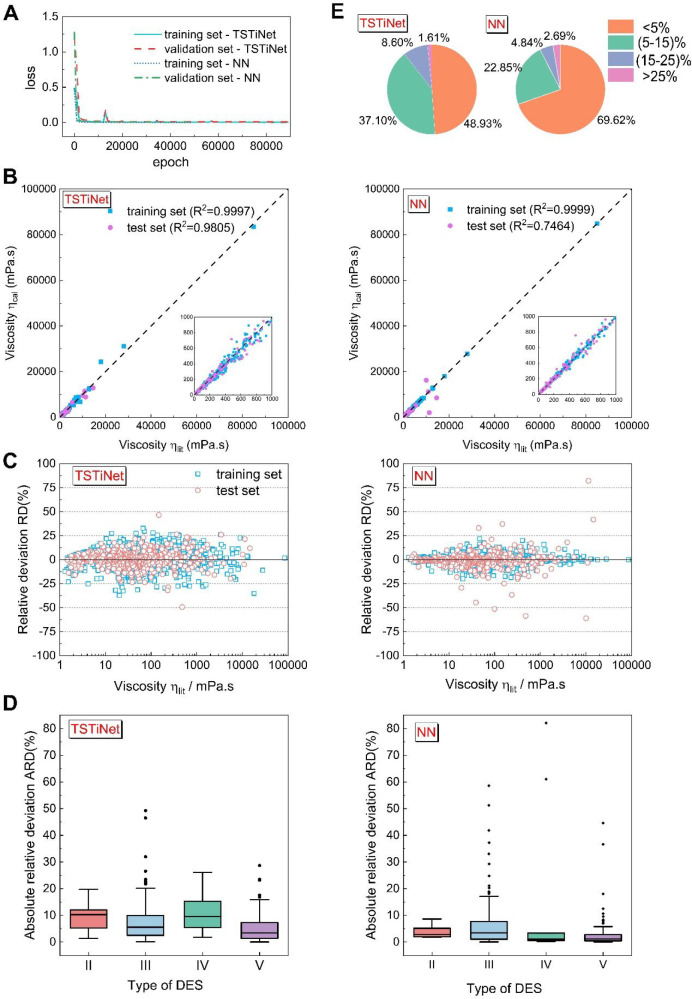
Figure 3.
Training processes and performances of the plain NN model and the TSTiNet model. (A) Learning curve of the TSTiNet model and the plain NN model. An epoch is when all the training data pass through the network during the training phase. (B) Correlation between the predicted and reported viscosity values of data sets. The achieved R2 on the training set and test set are given on the top. (C) Relative deviations between the literature and the predicted viscosity in both data sets. (D) Box plots of ARD on different types DESs. Each box shows the interquartile range (IQR between Q1 and Q3) for the corresponding set. The central mark (horizontal line) shows the median, and the whiskers show the rest of the distribution based on IQR (Q1 – 1.5 × IQR, Q3 + 1.5 × IQR). Data outside of this range are considered outliers and represented by dark dots. (E) Percentage of ARD on the test set in different ranges, which are <5%, 5–15%, 15–25%, and >25%.

