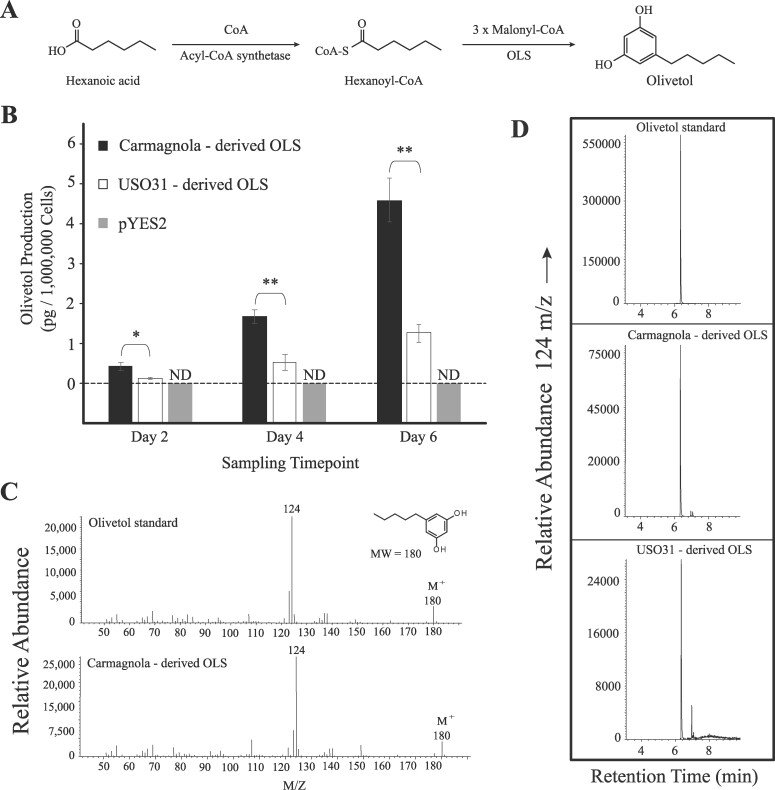
Figure 5.
Olivetol production in media supplemented with 1 mM hexanoic acid. (A) Synthesis of olivetol from hexanoic acid and hexanoyl-Coenzyme A (CoA) as described by Taura et al. (2009) and Kovalchuk et al. (2020). (B) Shown are bar plots comparing the mean (± standard deviation) olivetol production for biological triplicates of yeast colonies expressing the Carmagnola-derived OLS (black) and USO31-derived OLS (white). Yeast colonies transformed with empty pYES2 vector is shown in gray. Single asterisks indicate a t-test P-value less than 0.05 while double asterisks indicate a t-test P-value less than 0.01. The dashed horizontal line is used to indicate no detectible (ND) quantity of olivetol for colonies transformed with empty pYES2 vectors. (C) Mass spectra showing the major diagnostic ionization fragment and molecular ion (M+) for olivetol for the standard (top) and Carmagnola-derived OLS (bottom). (D) Chromatograms showing the retention time (min) for the peak containing the major diagnostic ionization fragment for olivetol for the olivetol standard, Carmagnola-derived OLS, and USO31-derived OLS.

