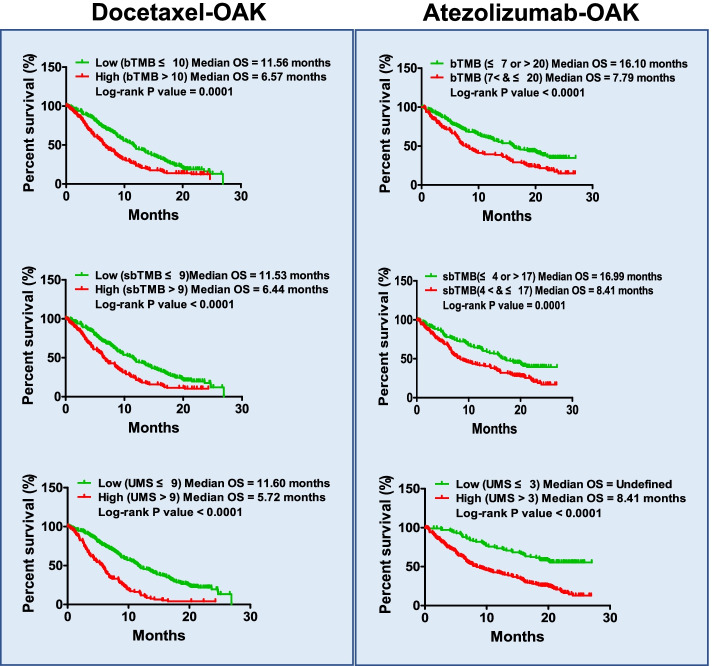
Fig. 1.
TMB and UMS were used as biomarkers for docetaxel and atezolizumab stratification in the discovery cohort. Left Kaplan-Meier plots of OS in NSCLC patients receiving docetaxel when using the biomarkers bTMB, sbTMB and UMS. The optimal cut-off values of the three biomarkers were determined for stratification. OS curves of responders and non-responders are shown on the top left (bTMB, responders: n = 165; non-responders: n = 153), middle left (sbTMB, responders: n = 181; non-responders: n = 137), and bottom left (UMS, responders: n = 207; non-responders: n = 111). Right Kaplan-Meier plots of OS in NSCLC patients receiving atezolizumab when using the biomarkers bTMB, sbTMB and UMS. The cut-off values of the three biomarkers were set as follows: bTMB: ≤ 7 or > 20; sbTMB: ≤ 4 or > 17; and UMS ≤ 3. OS curves of responders and non-responders are shown on the top right (bTMB, responders: n = 129; non-responders: n = 195), middle right (sbTMB, responders: n = 147; non-responders: n = 177), and bottom right (UMS, responders: n = 102; non-responders: n = 222)

