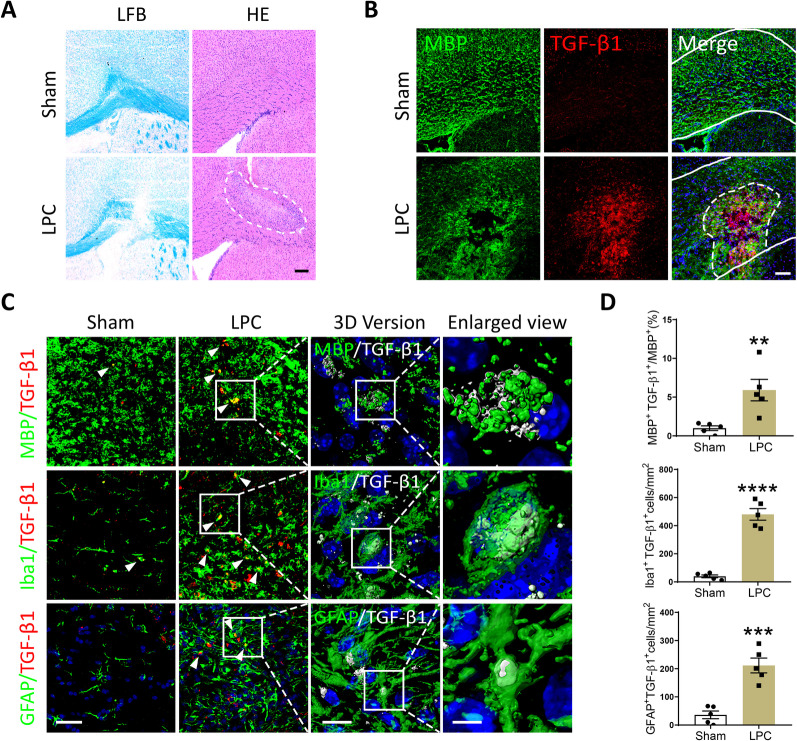
Fig. 1.
TGF-β1 accumulated in the demyelinating focus induced by LPC-injection. A Representative images of LFB and HE staining in the brain of LPC-modeling and Sham mice, scale bar = 200 μm. The lesion area was outlined with a white dotted line in HE staining. B Representative immunofluorescent staining of MBP and TGF-β1 in the corpus callosum of LPC-modeling and Sham mice, scale bar = 80 μm. The corpus callosum was outlined with white solid lines, while the lesion area was outlined with a white dotted line. C Representative confocal images of TGF-β1 with MBP, Iba1, and GFAP (scale bar = 30 μm), 3D reconstructed images (scale bar = 10 μm), and corresponding local enlarged views (scale bar = 3 μm) in the corpus callosum of LPC-modeling and Sham mice. White arrowheads pointed to the immunofluorescent double-labeling cells. D Quantitative analysis of MBP+TGF-β1+/MBP+, Iba1+TGF-β1+cells, and GFAP+TGF-β1+cells by immunofluorescence. Unpaired Student’s t-test was used for statistical analysis. **P < 0.01, ***P < 0.001, ****P < 0.0001 versus Sham group. N = 6 per group

