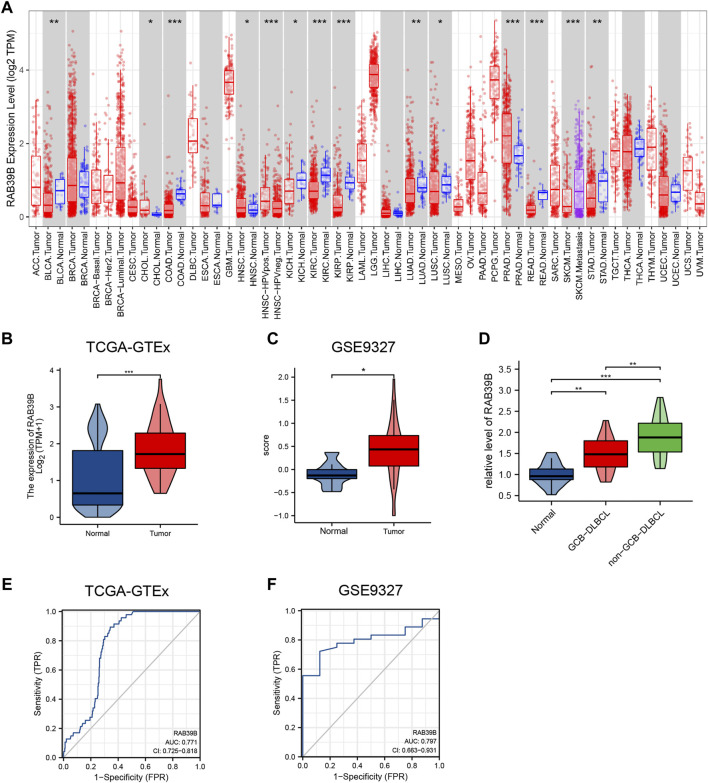
FIGURE 1.
Relationship between RAB39B expression and DLBCL. (A) TIMER database showed dysregulation of RAB39B in various cancers. (B) Expression of RAB39B between DLBCL and normal controls in TCGA–GTEx. (C) GSE9327 dataset was used to assess the RAB39B level between DLBCL and normal tissues. (D) Clinical samples showed the elevated expression of RAB39B in GCB-DLBCL, and this trend was much more pronounced in non-GCB DLBCL patients. (E,F) ROC analysis illustrated that RAB39B expression accurately discriminated DLBCL tumor tissues from normal tissues with an AUC of 0.771 (95% CI: 0.725–0.818) from TCGA–GTEx data and an AUC of 0.797 (95% CI: 0.663–0.931) from the GSE9327 dataset. *p < 0.05, **p < 0.01, and ***p < 0.001.

