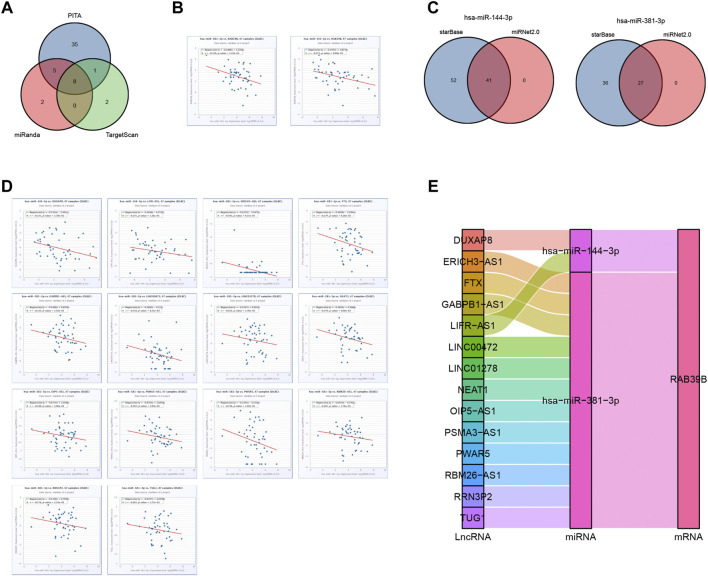
FIGURE 6.
RAB39B-related key ceRNA network construction in DLBCL. (A) Venn diagram of predicted RAB39B targets in PITA, miRanda, and TargetScan. (B) Correlation between RAB39B and the target miRNAs in scatter plots. (C) Venn diagram of predicted target lncRNAs of hsa-miR-144-3p and hsa-miR-381-3p in starBase and miRNet. (D) Correlation between hsa-miR-144-3p or hsa-miR-381-3p and the target lncRNAs in scatter plots. (E) lncRNA–miRNA–mRNA (RAB39B) regulatory network in line with the ceRNA hypothesis was constructed in the Sankey diagram.

