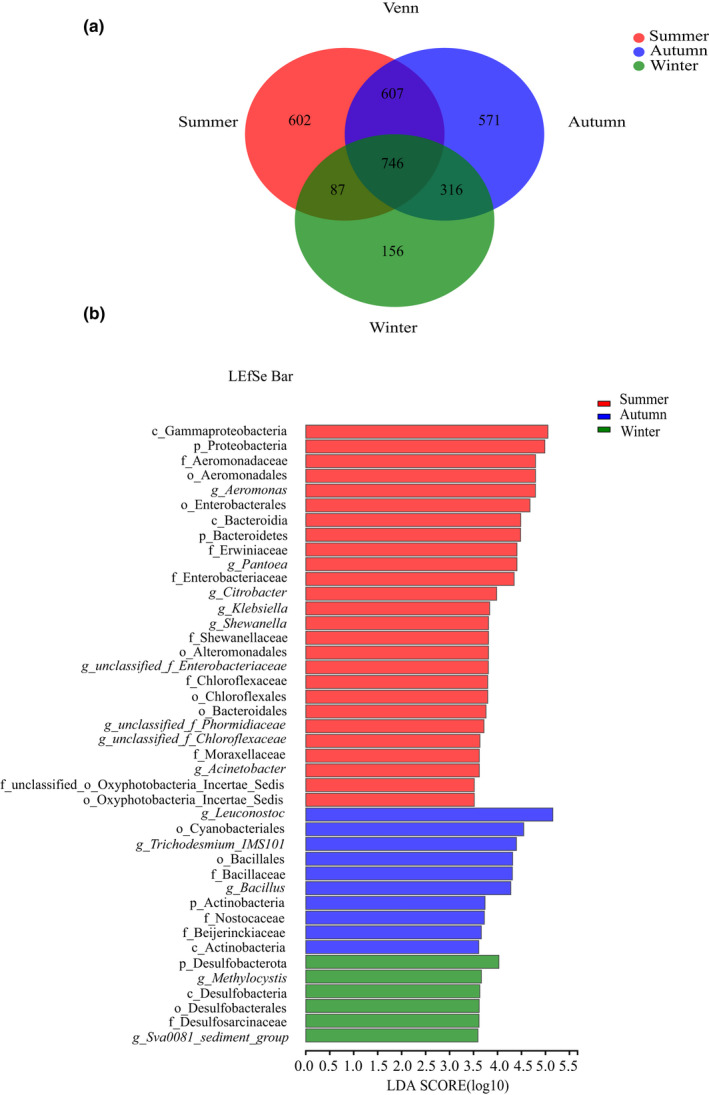
FIGURE 4.

(a): Venn chart shows the common and unique OTU between the groups. (b): LEfSe analysis of Pomacea canaliculata intestine microbiome from different seasons (|LDA| > 3.5, p < .05). Histogram of the LDA scores computed for features differentially abundant between groups. The c, g, f, o, p in diagram represent class, genus, family, order, and phylum, respectively.
