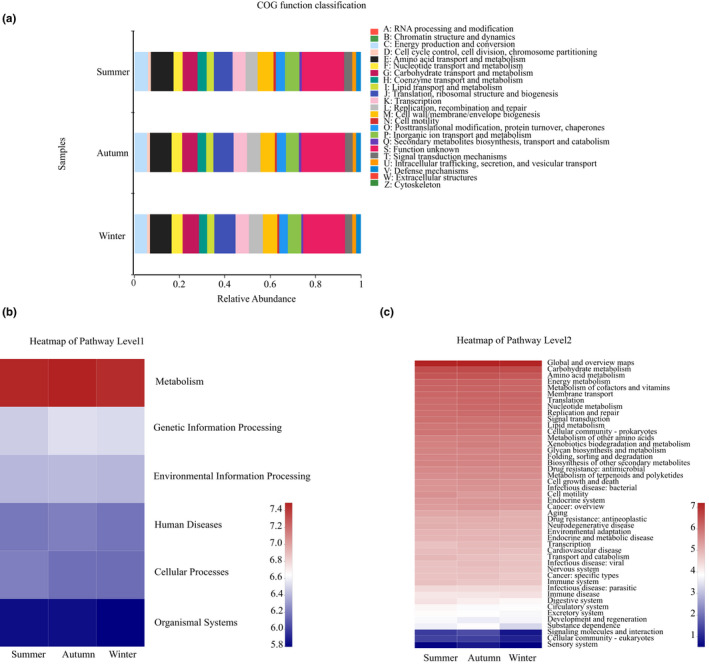
FIGURE 5.

(a): Gut microbiota predict metabolic functions from EggNOG database in the summer, autumn, and winter group. Relative abundance column diagram of microbiota functions based on the KEGG database. (b): Microbiota functions are shown on the first level; (c): microbiota functions are shown on the second level.
