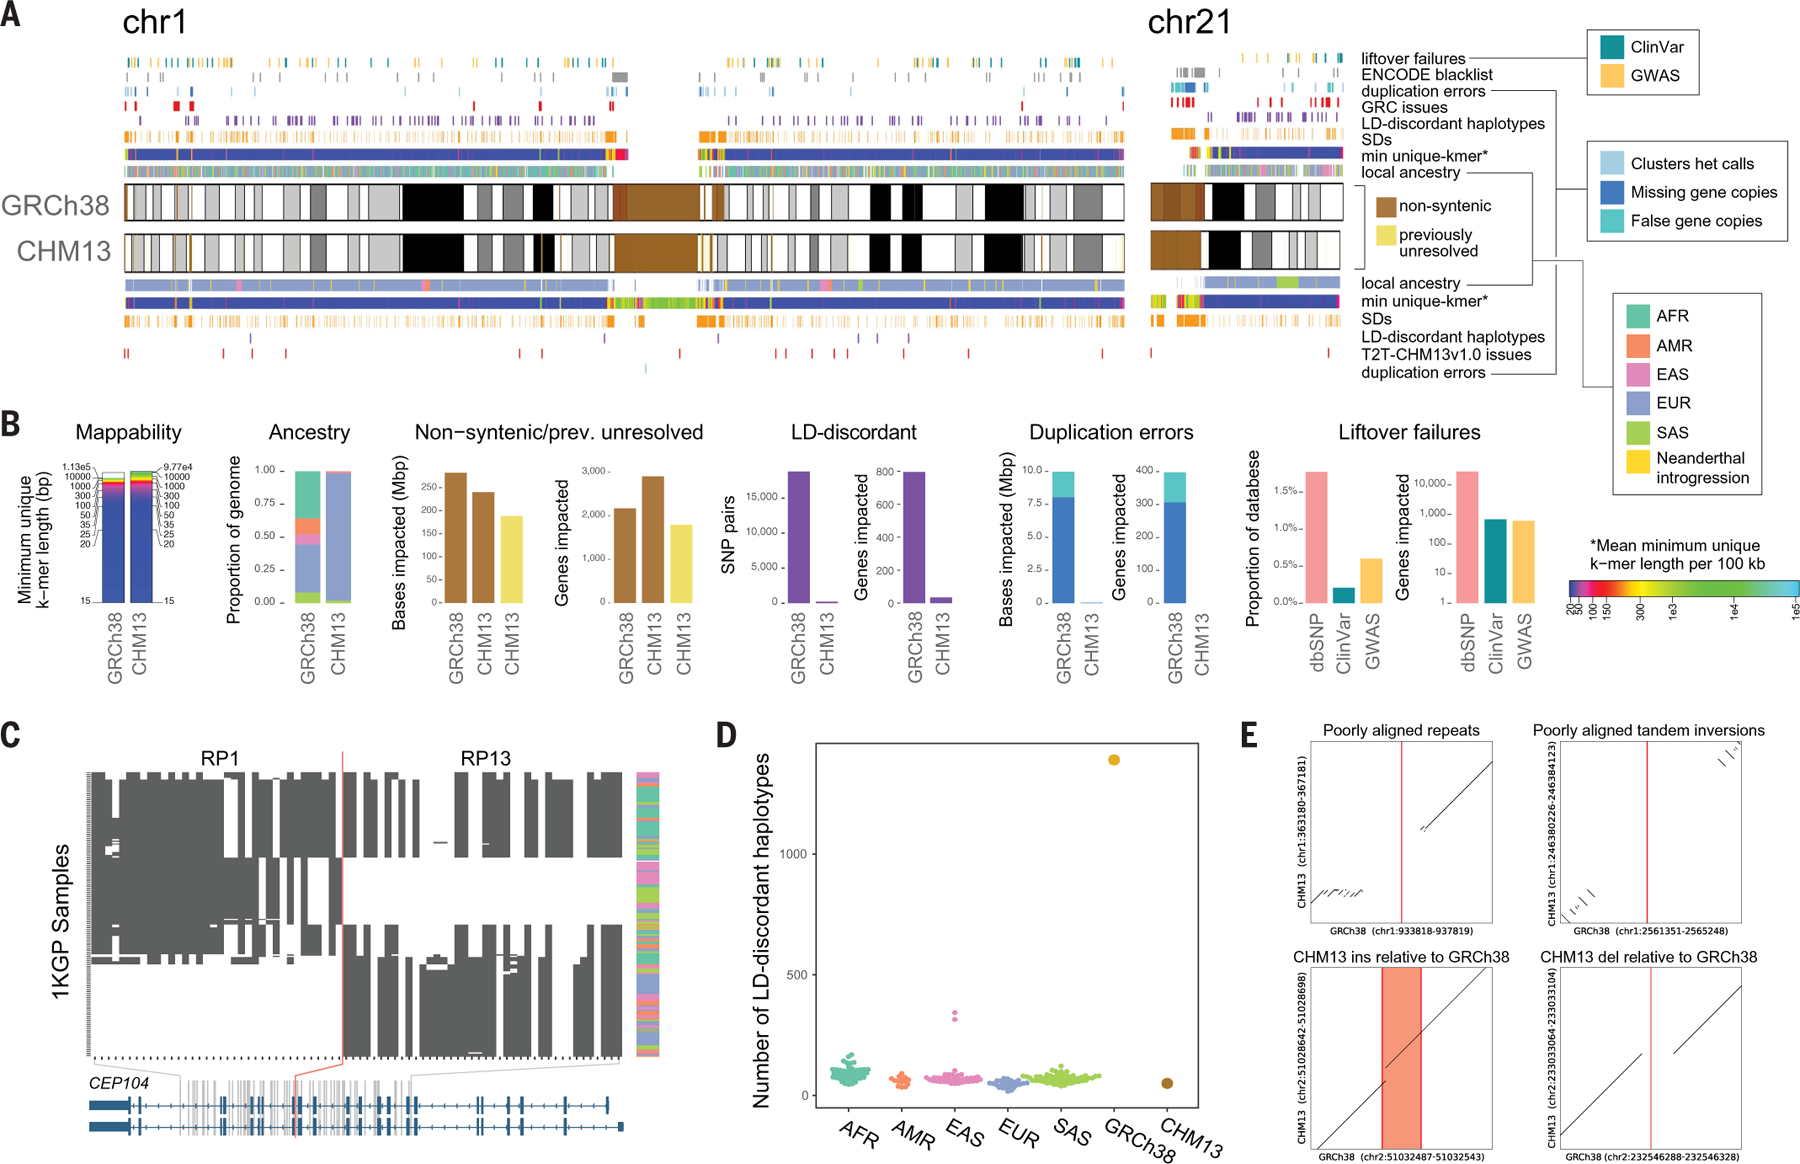
Fig. 1. Genomic comparisons of human assemblies GRCh38 and T2T-CHM13.

(A) Overview of annotations available for GRCh38 and T2T-CHM13 chromosomes 1 and 21 with colors indicated in legends, which are also used in (B) to (D). Colors for mean minimum (min) unique k-mers are defined in the legend with indicated asterisk. Cytobands are pictured as gray bands with red bands representing centromeric regions within ideograms. Complete annotations of all chromosomes can be found in figs. S1 to S4. Local ancestry is denoted using 1KGP superpopulation abbreviations (AFR, African; AMR, admixed American; EAS, East Asian; EUR, European; SAS, South Asian). (B) Summary of the number of bases and/or genes annotated by different features for the assemblies with colors indicated in the legends shown in (A). Note, dbSNP liftover failures (pink) are not annotated in (A). (C) Example of a clone boundary (red line) where GRCh38 possesses a combination of alleles that segregate in negative LD within the 1KGP sample (which we term as an “LD-discordant haplotype”). SNPs are depicted in columns; phased 1KGP samples are depicted in rows. White indicates reference allele genotype; black indicates alternative allele genotypes. Superpopulation ancestry of each sample is indicated in the rightmost column with colors indicated in local ancestry legend shown in (A). CEP104 splice isoforms (blue) are depicted at the bottom. (D) Tally of such LD-discordant haplotypes in a selection of 1KGP individuals, colored by population, as well as GRCh38 and T2T-CHM13. (E) Examples of variants that cannot be lifted over to T2T-CHM13 because of structural differences between the genomes. The position of the reference allele in GRCh38 is shown in red.
