
Fig. 4. Characterization of variants within regions of the genome resolved by T2T-CHM13.
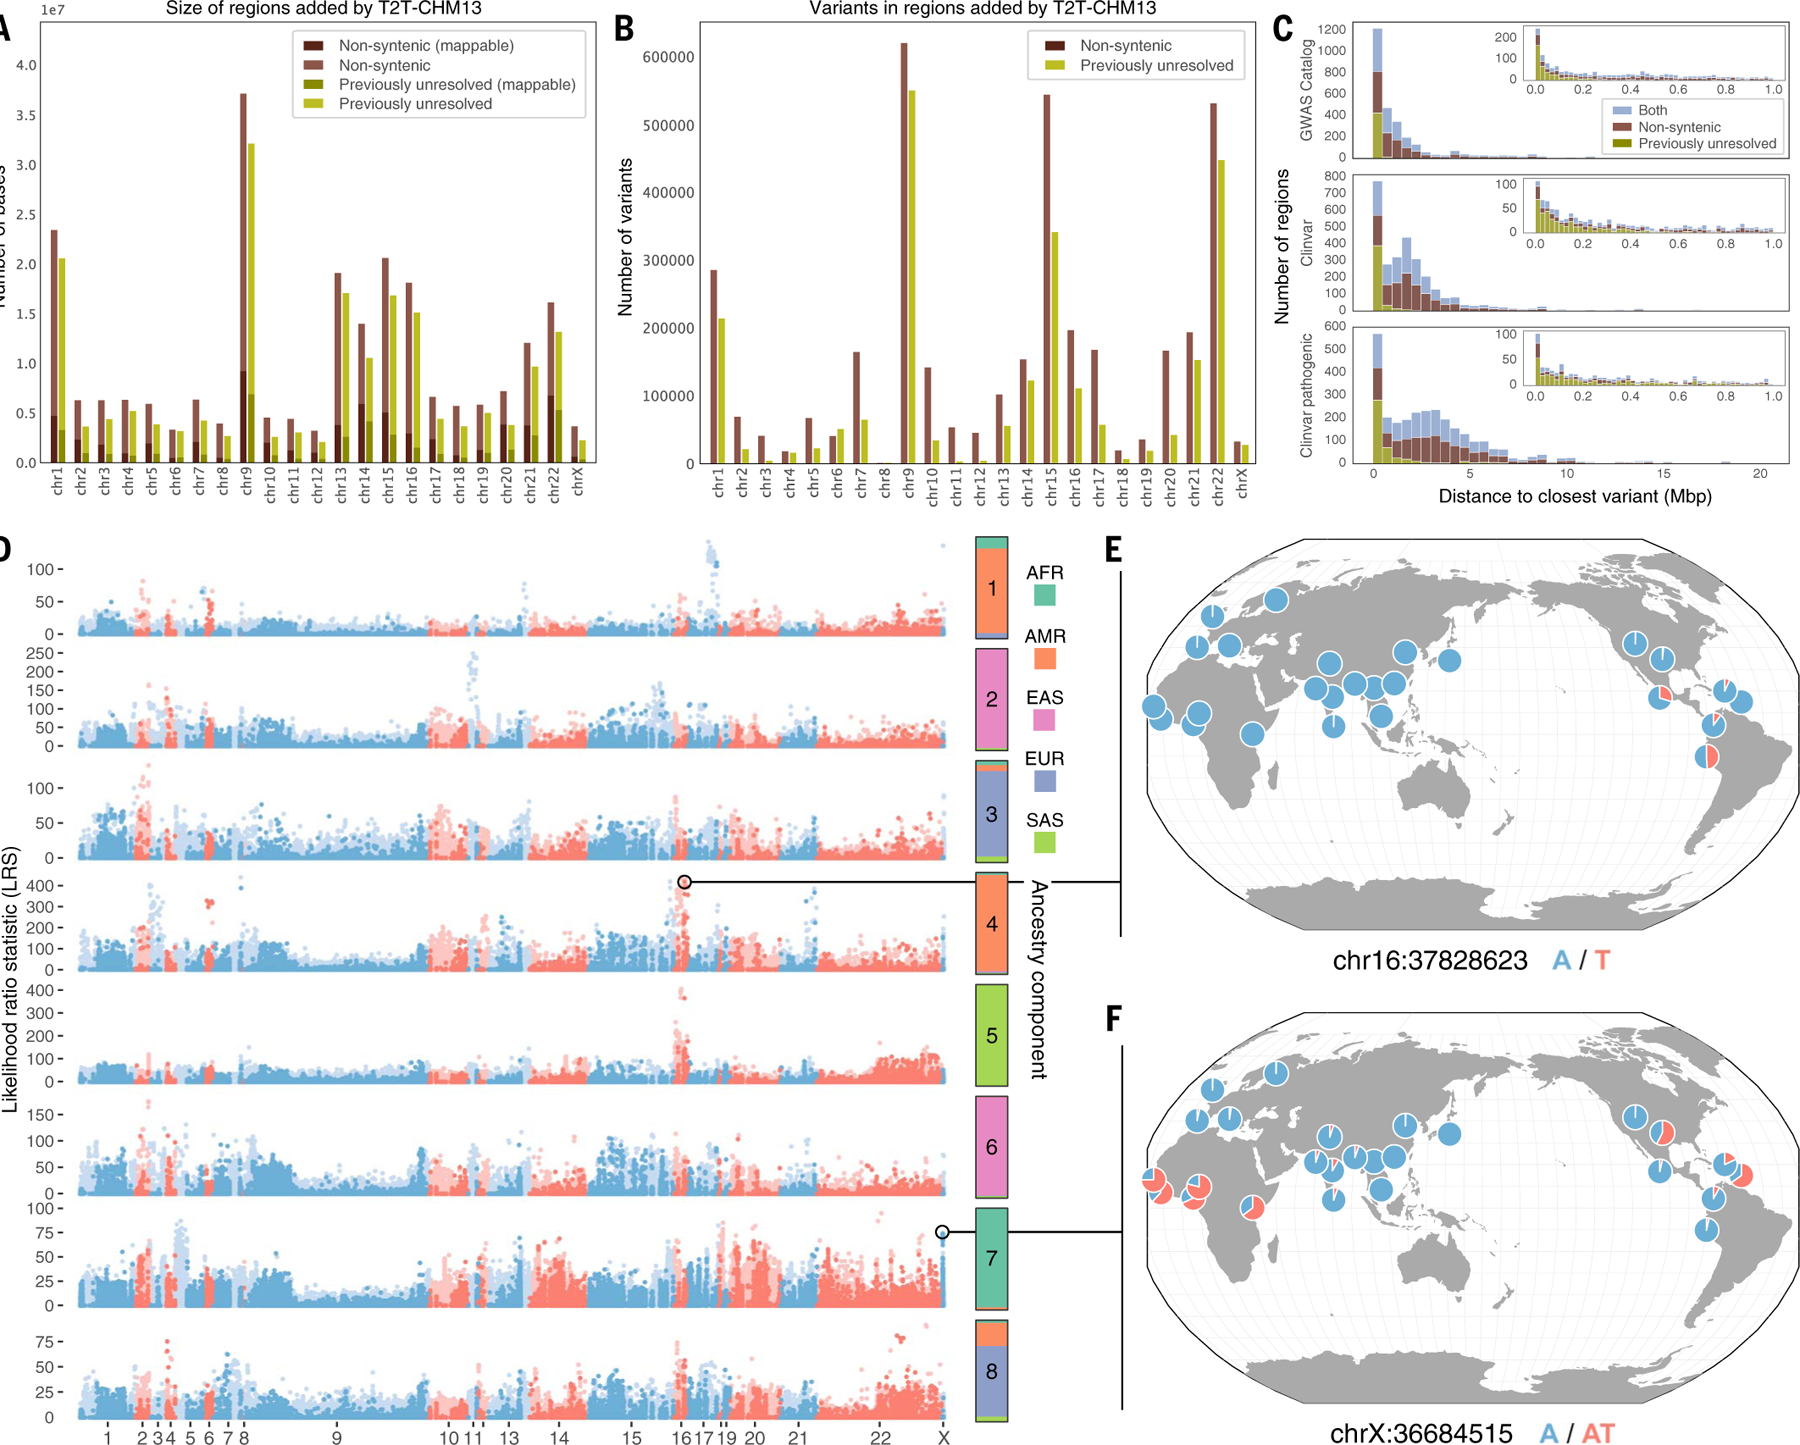
(A) Number of bases added in nonsyntenic and previously unresolved regions by chromosome, along with how many variants for each respective region are mappable (have contiguous unique 100mers). (B) Number of variants in nonsyntenic and previously unresolved regions by chromosome. (C) Distance from each previously unresolved–only, nonsyntenic-only, or overlapping region to the closest Clinvar or GWAS Catalog variant. Insets are zoomed to 1 Mbp. (D) Scan for variants in nonsyntenic (light blue and red) and previously unresolved (dark blue and red) regions that exhibit extreme patterns of allele frequency differentiation. Allele frequency outliers were identified for each of eight ancestry components, colored by the superpopulation membership of the corresponding 1KGP samples. Large values of the likelihood ratio statistic (LRS) denote variants for which AF differences in the corresponding ancestry component exceeds that of a null model based on genome-wide covariances in allele frequencies. (E and F) Population-specific allele frequencies of two highly differentiated variants in previously unresolved regions.