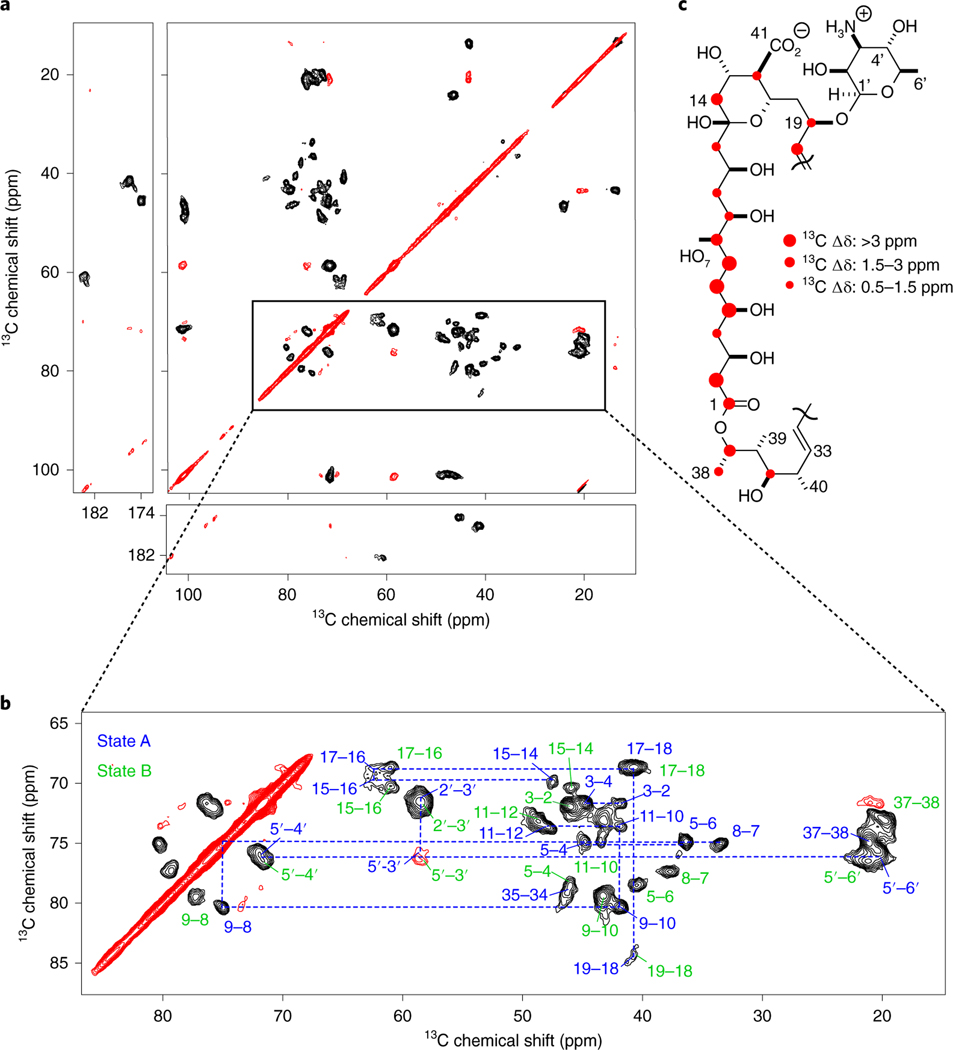
Fig. 2 |. AmB exists in two states.
a, 13C–13C 2D SPC mixing spectrum of the homogenous AmB sample. b, AmB C1–C13 region showing 1- and 2-bond correlations that allowed for assigning two AmB populations. Chemical shift assignments of state A and state B are presented in blue and green, respectively. c, Graphical representation of the 13C chemical shift differences between two states of AmB. The biggest changes are observed on carbons 2, 5, 6 and 7 of the C1–C13 region.

