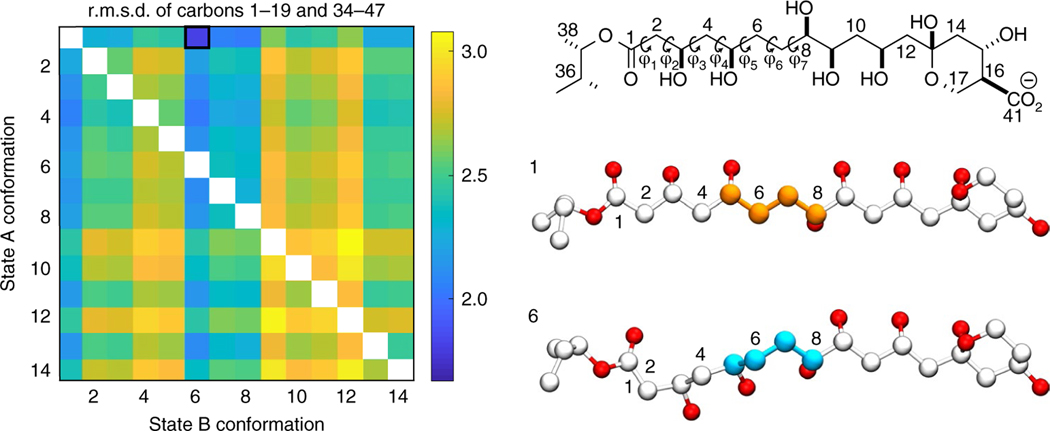
Fig. 3 |. DFT calculations of AmB state A and state B conformations.
Heatmap displaying the r.m.s.d. (from blue as the lowest and yellow as the highest r.m.s.d.) between experimentally measured and calculated chemical shifts for carbon atoms 1–19 and 34–47 for pairs of AmB structures with varied conformations of the C1–C13 regions labeled 1–14. Based on the r.m.s.d. comparisons in the heatmap, the best pair of structures contains structure number 1 as state A and structure number 6 as state B. Carbons 5–8 are highlighted to illustrate the difference in C1–C13 region dihedral geometry between state A and state B.

