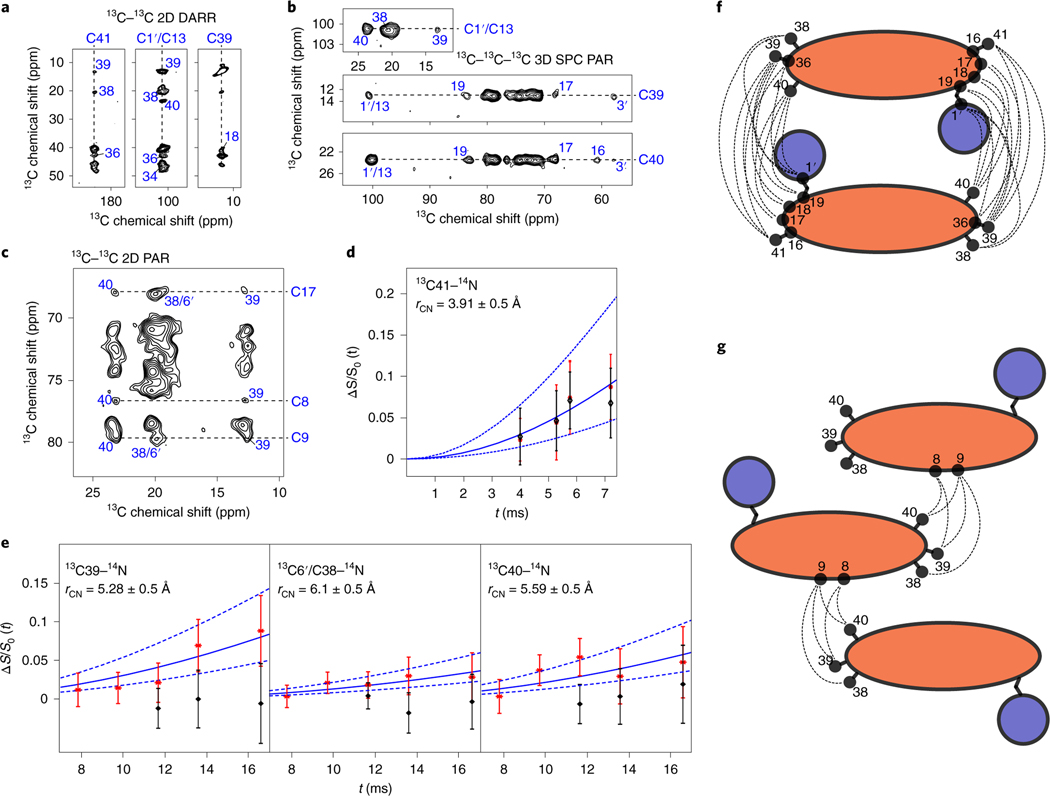
Fig. 4 |. SSNMR experiments indicate an asymmetric AmB homodimer structure.
a–c, Representative regions of the SSNMR spectra: 13C–13C 2D 1,000 ms DARR spectrum of the homogenous [13C] skip-labeled AmB (a); 13C–13C–13C 3D SPC PAR spectrum of the homogenous [U-13C]AmB (b); and 13C–13C 2D 11 ms PAR spectrum of the homogenous [U-13C]AmB showing head-to-tail interactions between AmB molecules as well as interactions between AmB C1–C13 middle region and the tail methyls (c); namely, between C41 and C36, C38, C39; C1′/C13 and C34, C36, C38, C39, C40; C39 and C18 (a); between C1′/C13 and C38, C39, C40; C39 and C1′/C13, C3′, C17, C19; C40 and C1′/C13, C3′, C16, C17, C19 (b); and between C17 and C38, C39, C40; C8 and C39, C40; C9 and C40, C38, C39 (c). d,e, PM-RESPDOR experiments of homogenized [13C] skip-labeled AmB. d, experimental ΔS/S0(t) dipolar curves of 13C41 (183 ppm)–14N under two different lengths of PM-RESPDOR pulses: tPM = 14TR and tPM = 24TR (black diamonds). Solid blue lines represent Bessel function (equation (1.1)) with optimal distance of 3.91 Å (D = 36.49 Hz). ν1 = 25kHz, νR = 12.5kHz. Dashed blue lines represent the cases when rCN = 3.41 and 4.41 Å, respectively. e, experimental ΔS/S0(t) curves (red stars) of 13C39 (11 ppm)–14N, 13C6′/13C38 (18 ppm)–14N and 13C40 (23 ppm)–14N, and their comparison with Bessel function (blue solid line) with optimal distances: r = 5.28 Å (D = 14.82 Hz), r = 6.1 Å (D = 9.61 Hz) and r = 5.59 Å (D = 12.49 Hz), respectively. For d and e, distances were found using least squares fitting (Levenberg–Marquardt method). Blue dashed lines represent Bessel functions with ±0.5 Å of deviation in each case, which were estimated according to the experimental errors. experimental parameters for red stars were: v1 = 25 kHz and tPM = 14TR. The first two black diamond points represent the experimental curves with v1= 0 kHz during S part. The last point (for each methyl) was obtained when the PM-RESDOR pulse was applied before proton excitation. The experimental errors were defined as the noise level intensities of the 1D 13C spectra, where the zero signals were expected. f,g, Graphical illustrations of the intermolecular interactions: f for panels a and b, and g for panel c.

