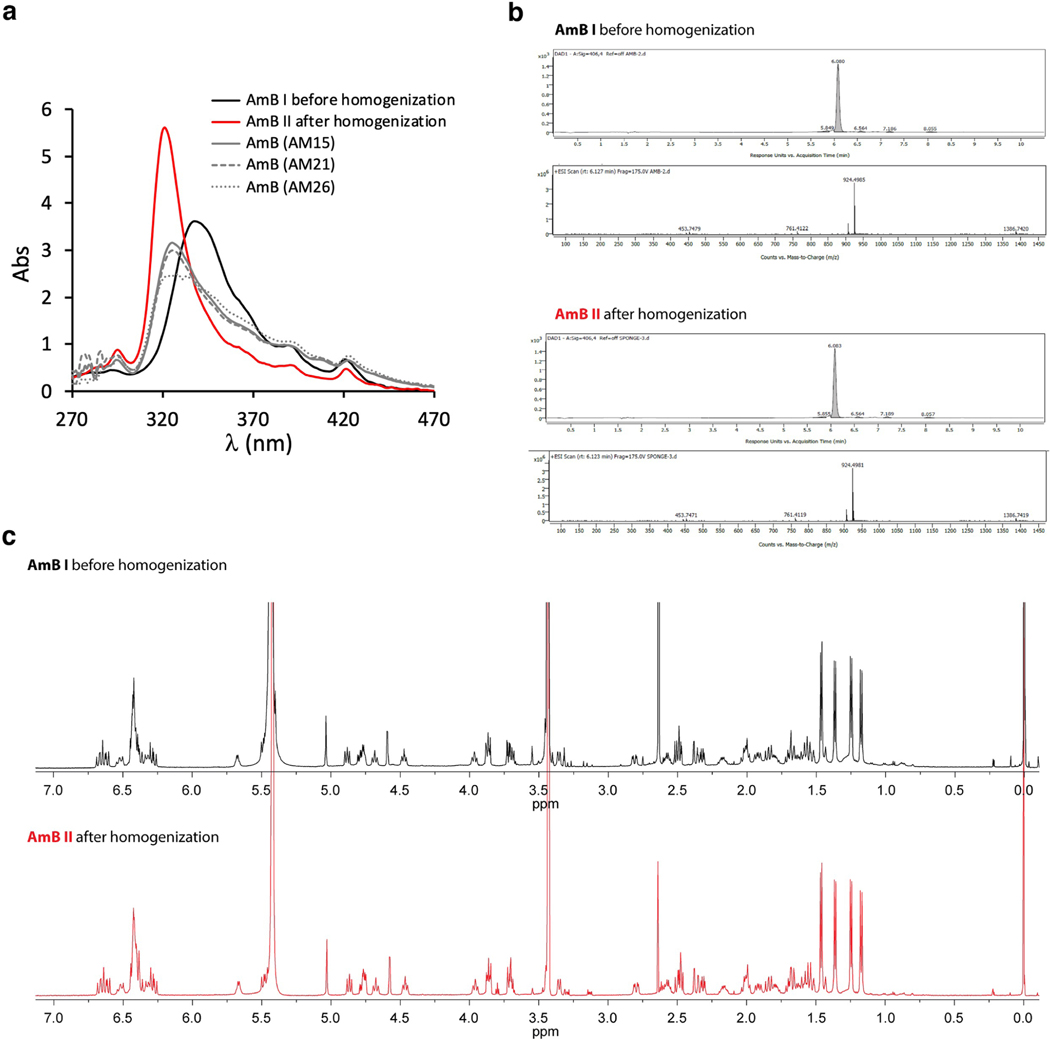
Extended Data Fig. 1 |. AmB homogenization validation.
(a) UV-Vis spectra of AmB aggregates before (black) and after (red) homogenization. Grey UV-Vis spectra correspond to representative samples from the middle of the PC1 range (Fig. 1e). (b) LC-MS spectra of AmB before and after homogenization. (c) 1H NMR spectra of AmB before (black line) and after (red line) homogenization.

