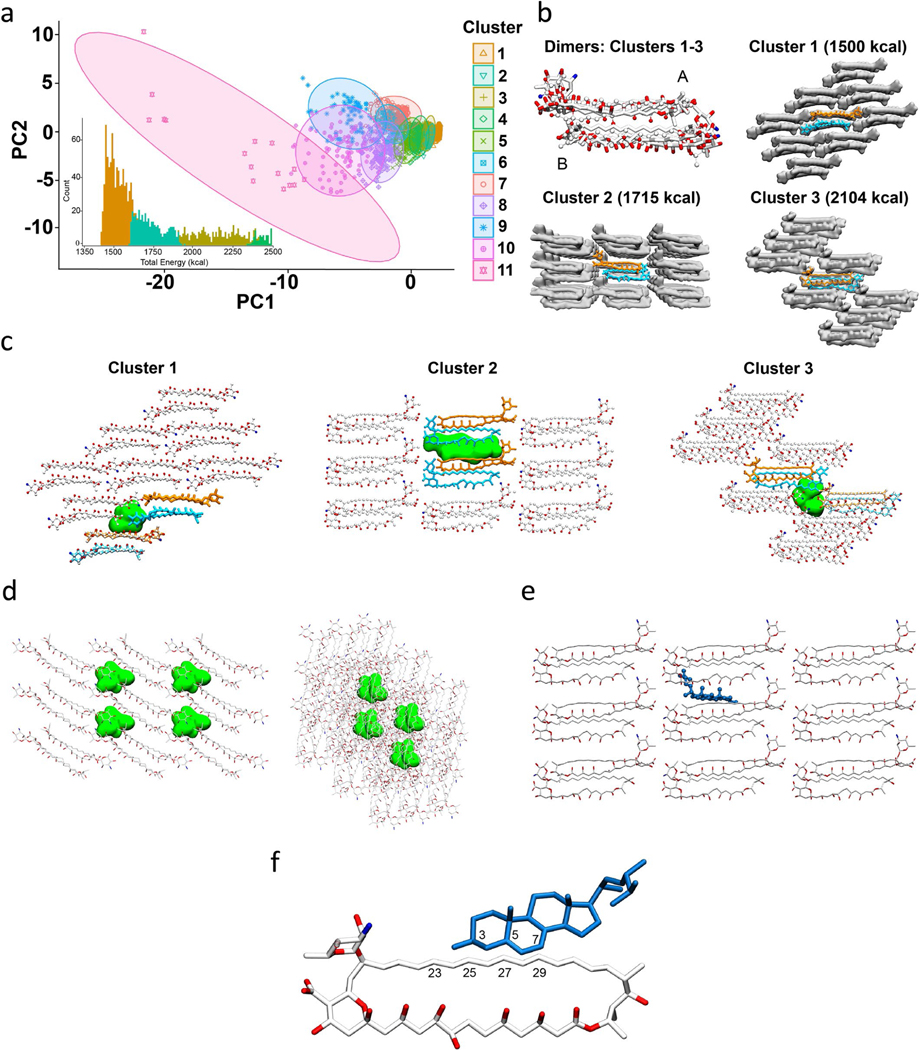
Extended Data Fig. 2 |. AmB cluster analysis and Erg docking.
(a) Principal component analysis (PCA) of the 9-dimensional data used for dimer structure clustering analysis for all 11 cluster ensembles. The inset shows the lowest clusters’ energies overlaid on the total energy histogram. (b) Alignment of medoid dimer structures of clusters 1–3 and lattice structures of medoid structures from the lowest energy cluster; states A and B of AmB are marked. (c) Medoid lattices of clusters 1–3 showing representative void volumes in green. Approximate volumes for each void in clusters 1–3 are 390 Å3, 830 Å3, and 530 Å3, respectively. The volume of ergosterol is estimated to be 427 Å3 21. (d) Snapshots of all four void pockets found in cluster 1 lattice - front view (left) and side view (right). The volume of each pocket is approximately 390 Å3. The number density of this lattice is 6.36 molecules per 10,000 Å3. (e) Snapshot of an ergosterol molecule (cpk-blue) docked to the cluster 2 medoid lattice – front view. (f) Close-up snapshot of AmB (white) – ergosterol (blue) docked interaction as seen in (e). Select atom numbers near interaction site are labeled for both AmB and ergosterol molecules.

