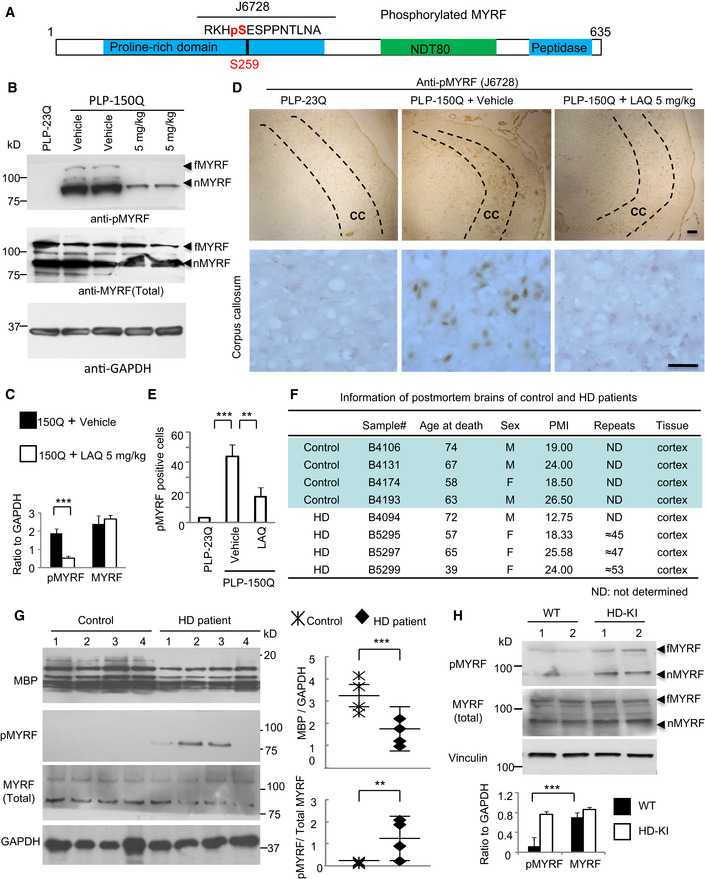
Anti‐Ser259‐MYRF antibody was generated using the peptides containing pS259.
Western blotting analysis of the corpus callosum in PLP‐23Q or PLP‐150Q mice with anti‐pS259 and an antibody to total MYRF. Note that LAQ (5 mg/kg) treatment for 2 months decreased the phosphorylation in both full‐length (fMYRF) and N‐terminal MYRF (nMYRF) in PLP‐150Q mice.
Ratios of phosphor‐S259‐MYRF (pMYRF) and total MYRF to GAPDH. The ratios were obtained from three independent Western blotting experiments. Student's t‐test; ***P = 0.0007. Data are mean ± SEM.
Anti‐Ser259‐MYRF immunohistochemical staining of the corpus callosum (CC, indicated between two dotted lines) of PLP‐23Q and PLP‐150Q mice showing decreased expression of Ser259‐MYRF by LAQ (5 mg/kg) treatment for 2 months. Micrographs at 10× (upper) and 40× (lower) are shown. Scale bars: 40 μm.
Quantitative statistics of the cells stained by anti‐Ser259 MYRF in each field was presented. Twenty random fields (40×) of each section were examined to count anti‐Ser259‐positive cells, n = 3 mice in each group. One‐way ANOVA with Tukey's test. ***P = 0.0003; **P = 0.0039. Data are mean ± SEM.
Information of post‐mortem brains of control and HD patients.
Western blotting analysis of MBP and Ser259‐MYRF expression in the post‐mortem brain cortex tissues in 4 HD patients and 4 non‐HD control individuals. Ratios of MBP to GAPDH, or Ser259 (pMYRF) to total MYRF are presented on the right. One‐way ANOVA with Tukey's test. MBP: ***P = 0.0004; pMYRF: **P = 0.0051. Data are mean ± SEM.
Western blotting analysis of the expression of Ser259 (pMYRF) and total MYRF (full‐length: fMYRF and N‐terminal: nMYRF) in 13‐month‐old HD‐KI and WT mouse cortex. Ratios of pMYRF to total MYRF obtained from three independent experiments were presented beneath the blots. One‐way ANOVA with Tukey's test. ***P = 0.00083. Data are mean ± SEM.

