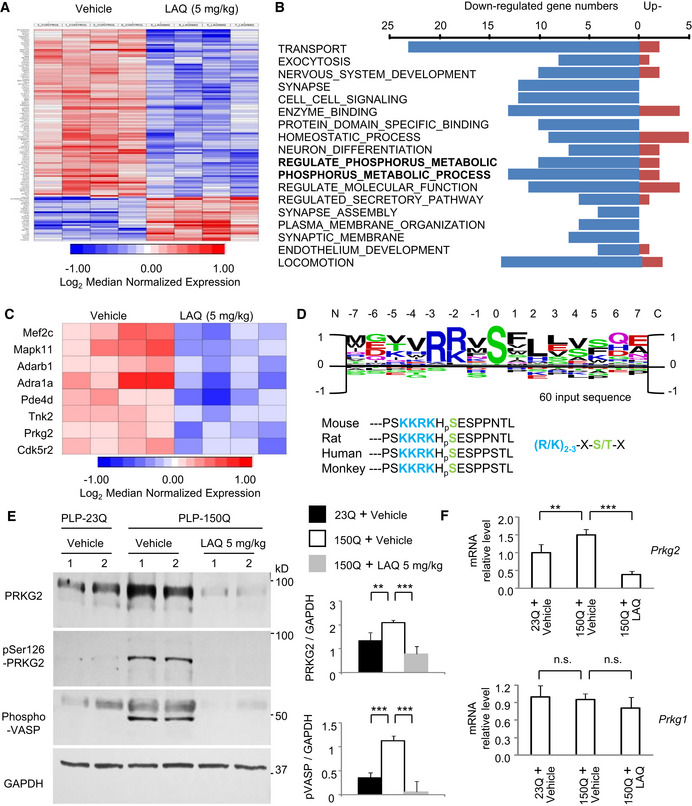
Heatmaps of gene expression in PLP‐150Q mouse corpus callosum at 5 months after LAQ (5 mg/kg) treatment for 2 months revealed 27 significantly upregulated and 103 significantly downregulated genes.
Most significant gene networks of different functions via GO‐cluster and categorization. The bold‐type indicated two phosphorylation associated clusters of “REGULATE_OF_PHOSPHORUS_METABOLIC_PROCESS” and “POSITIVE_REGULATE_OF_PHOSPHORUS_METABOLIC_PROCESS”.
The individual networks of upregulated gene were heat‐mapped typically, on the clusters of “REGULATE_OF_PHOSPHORUS_METABOLIC_PROCESS” and “POSITIVE_REGULATE_OF_PHOSPHORUS_METABOLIC _PROCESS”.
Identification of consensus sequences from PRKG2 kinase substrate peaks, in which the same motif was identified using the 15 amino acid sequences surrounding the strongest 60 peaks. The PRKG2 substrate core consensus sequences of (R/K)2‐3‐X‐S/T‐X, where S = serine, R = arginine, K = lysine, T = threonine, X standing for any random amino acid, are mostly consistent with MYRF amino acid 252‐266. The rat, monkey, and human MYRF have the highly conserved core sequences of “KKRKHSE”.
Western blotting showing down‐regulation of PRKG2 in PLP‐150Q mouse corpus callosum at 3 months of age by 5 mg/kg LAQ. Ratios of PRKG2 or phosphorylated VASP (p‐VASP) to GAPDH obtained from three independent experiments were presented on the right. One‐way ANOVA with Tukey's test. PRKG2: **P = 0.0076 (left) and ***P = 0.0015 (right); p‐VASP: ***P = 3.86 × 10⁻⁵ (left) and 1.01 × 10⁻⁵ (right). Data are mean ± SEM.
Quantitative PCR of PRKG2 or PRKG1 gene expression in PLP‐150Q mouse corpus callosum at 5 months of age after LAQ (5 mg/kg) treatment for 2 months. Only PRKG2 was decreased by LAQ. n = 3 mice in each group. Student's t‐test; **P = 0.0073; ***P = 0.00041. Data are mean ± SEM.