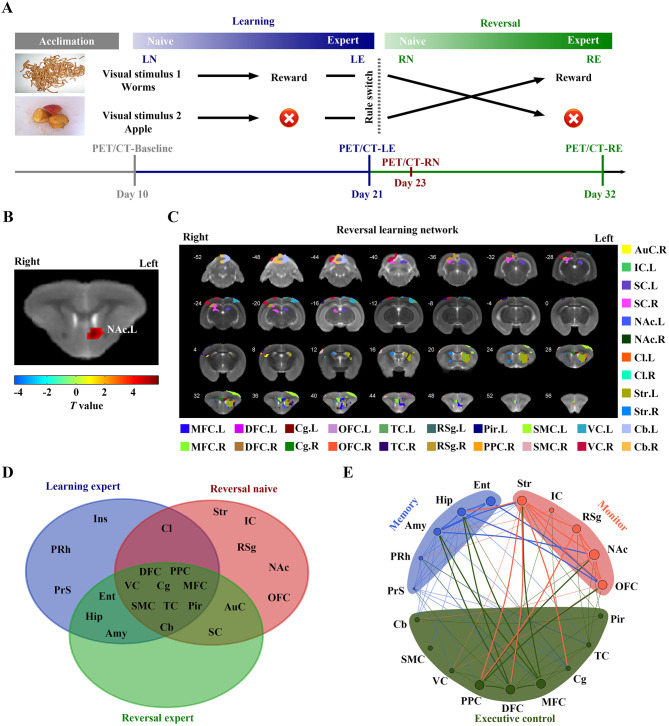
Figure 1.
Variations in collaborative network patterns during visual discrimination learning and reversal learning (RL) in brains of tree shrews
A: Schematics of visual discrimination tasks and 18F-FDG PET/CT imaging. B: Voxel-wise comparisons between RN and LE stage. Significant hyper-metabolism region was found in left NAc in RN stage (P<0.05, FWE-corrected, cluster size>50).T value, value of two-sample t-test. C: Sub-region location of RL network in tree shrew brain. D: Venn diagram showing overlap of metabolic networks involved in LE, RN, and RE stages. E: Schematic of functional systems engaged in dynamic visual discrimination tasks. LN, learning naive; LE, learning expert; RN, reversal naive; RE, reversal expert. MFC, medial frontal cortex; DFC, dorsal frontal cortex; Cg, cingulate cortex; OFC, orbital frontal cortex; TC, temporal cortex; RSg, retrosplenial granular cortex; Pir, piriform cortex; PPC, posterior parietal cortex; SMC, sensorimotor cortex; VC, visual cortex; AuC, auditory cortex; Ent, entorhinal cortex; Ins, insular cortex; PRh, perirhinal cortex; PrS, presubiculum; Hip, hippocampus; Amy, amygdala; IC, inferior colliculus; SC, superior colliculus; NAc, accumbens nucleus; Cl, claustrum; Str, striatum; Cb, cerebellum. L, left hemisphere; R, right hemisphere.

