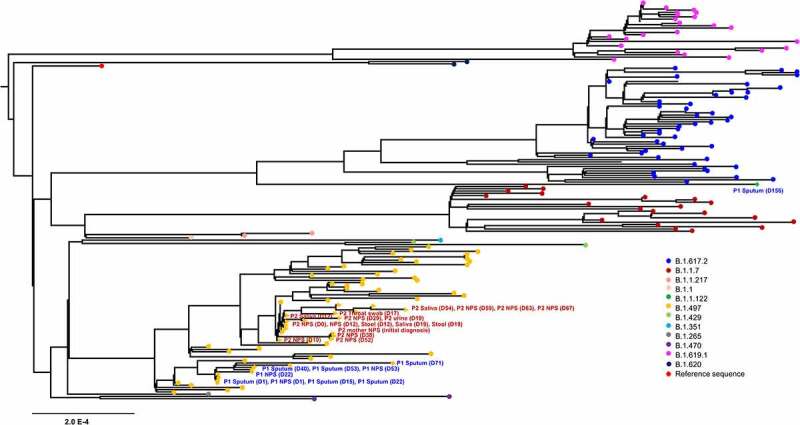
Figure 1.

Phylogenetic analysis of severe acute respiratory syndrome coronavirus 2 strains. A maximum likelihood phylogenetic tree was generated with 27 sequences from this study (yellow, n = 26; green, n = 1) and 149 SARS-CoV-2 genomes obtained from GISAID. All of the SARS-CoV-2 genomes in South Korea were downloaded from the GISAID database, and 149 sequences that matched the proportion of sequences and date range of sample collection as the total dataset were obtained. Diamond and triangle at each branch tip represent samples from patient 1 and patient 2, respectively.
