
Figure 2.
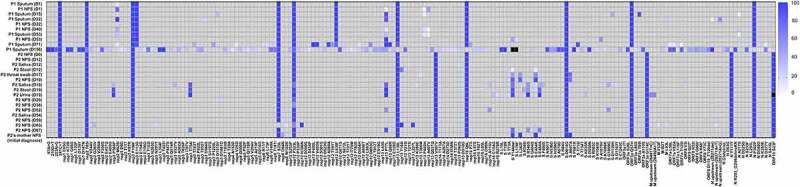
Heatmap representing SARS-CoV-2 variant allele frequency of each variant detected in the samples. Variants that were not detected because of low coverage are shown in black.
Official websites use .gov
A
.gov website belongs to an official
government organization in the United States.
Secure .gov websites use HTTPS
A lock (
) or https:// means you've safely
connected to the .gov website. Share sensitive
information only on official, secure websites.
Heatmap representing SARS-CoV-2 variant allele frequency of each variant detected in the samples. Variants that were not detected because of low coverage are shown in black.