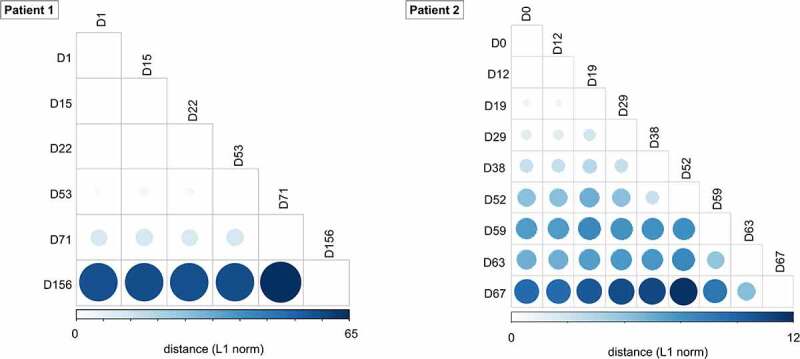
Figure 3.

Pairwise genetic distance among serial SARS-CoV-2 respiratory samples during the course of infection. The L1 norm genetic distances are shown by a colour gradient and size difference. Sputum specimens (patient 1) and nasopharyngeal swabs (patient 2) for each time point were analysed.
