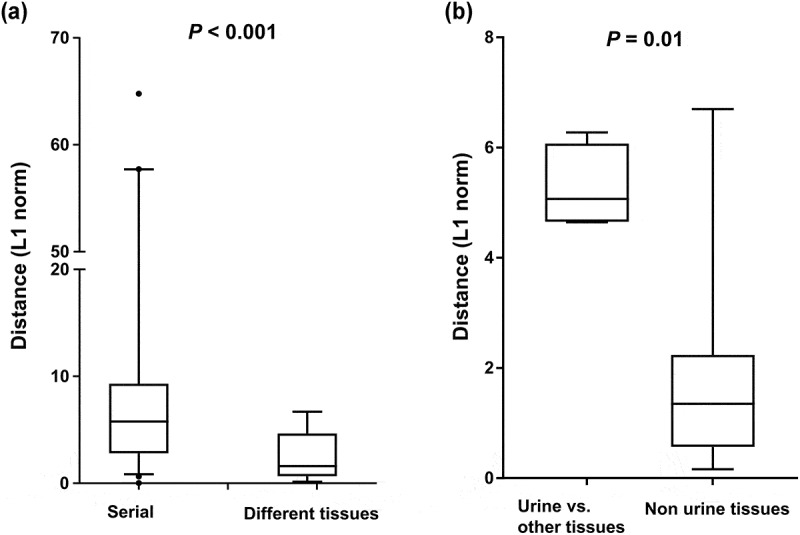
Figure 5.

Genetic distance between sample pairs. (a) Sample pairs were classified into three subgroups: (1) intrahost sample pairs obtained at different time points, (2) intrahost sample pairs obtained from different anatomic sites. (b) the sample pairs were categorized into urine/non-urine sample pairs and non-urine/non-urine sample pairs. Box (median ± 25%) and whisker (5% and 95%) plots represent the distribution of the genetic distances (L1 norm) between sample pairs.
