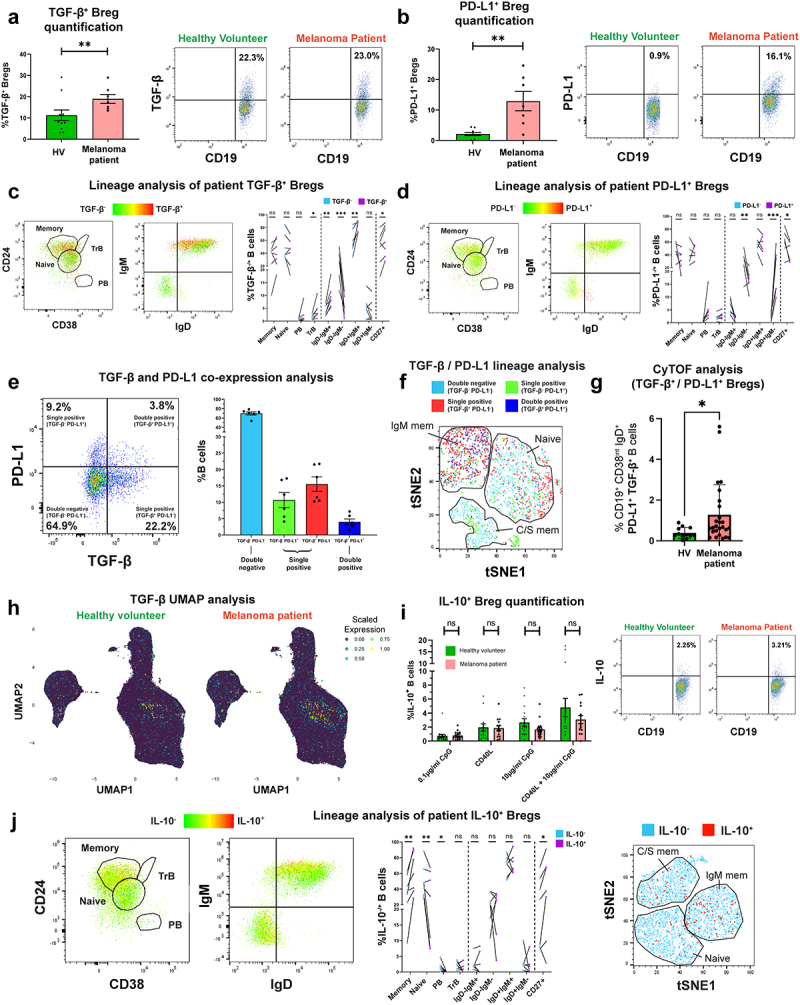
Figure 1.

TGF-β- and PD-L1-expressing Bregs are enriched in melanoma patient compared to healthy volunteer peripheral blood and show preference toward specific B cell lineage phenotypes.
(a-b) [Left] Comparison of % TGF-β-expressing (a) and PD-L1-expressing (b) B cells in melanoma patients (N = 7) and matched healthy volunteers (N = 11). [Right] Flow cytometry plots show gating of CD19+ B cells by TGF-β or PD-L1 expression from a representative healthy volunteer and melanoma patient. (c-d) Live single CD19+ B cells from melanoma patient blood were gated prior to TGF-β+ (c) or PD-L1 (d) B cell lineage analyses. [Left] Flow cytometry plots highlighting identification of B cell lineage (CD24hiCD38− memory B cells, CD24hiCD38hi transitional B cells (TrB), CD24intCD38int naïve B cells and CD24−CD38++ plasmablasts (PB)), and immunoglobulin isotype distribution in a representative patient. Cells are colored according to TGF-β or PD-L1 expression (gree low; red = high). [Right] B cell lineage analysis by TGF-β or PD-L1 expression (N = 7). % TGF-β- or PD-L1-expressing B cells showing particular B cell lineage phenotypes versus baseline phenotype (TGF-β-negative or PD-L1-negative cells) to identify phenotypic preference. (e) TGF-β/PD-L1 co-expression analysis showing single (TGF-β− PD-L1+; TGF-β+ PD-L1−) and double (TGF-β+ PD-L1+) expressing populations. [Left] Flow cytometry dot plot for representative melanoma patient sample and [right] quantification for N = 6 melanoma patients. (f) tSNE projections cluster B cells according to CD27, IgD, IgM, CD24, and CD38 expression. Largest populations by FLOWSOM clustering were naïve, IgM memory, and isotype-switched (C/S) memory B cells. Cells were colored according to TGF-β and PD-L1 expression (light blue = double negative, green/red = single positive, dark blue = double positive). (g) CyTOF phenotyping of B cell subsets (34-marker panel) identified enrichment in CD19+CD38intIgD+CD27− PD-L1+TGF-β+ regulatory B cells in patients (N = 26) compared to matched healthy volunteers (N = 12). (h) UMAP clustering analysis demonstrates enriched TGF-β+ (green and yellow) phenotypic population distribution in melanoma patients versus healthy volunteers. Cells clustered according to extracellular marker expression (CyTOF 19-marker panel) and colored corresponding to scaled expression of TGF-β (purple (0.00) to yellow (1.00)). (i) [Left] Comparisons of % IL-10-expressing B cells in melanoma patients (N = 18) and matched healthy volunteers (N = 17) following 72-hour culture with activation stimuli (0.1 µg/ml CpG, CD40L, 10 µg/ml CpG, or CD40L+10 µg/ml CpG). [Right] Flow cytometry plots show gating of CD19+ B cells by IL-10 expression from a representative healthy volunteer and melanoma patient (CD40L+10 µg/ml CpG condition). (j) B cell lineage analyses of live single IL-10+CD19+ B cells from melanoma patient blood. [Left] Flow cytometry plots highlighting B cell lineage and immunoglobulin isotype distribution in a representative patient (cells colored according to IL-10 expression, green = low; red = high). [Middle] Lineage analysis of B cells by IL-10 expression (N = 7). IL-10-expressing B cells were more likely to possess a memory B cell phenotype, above baseline. [Right] tSNE projections cluster B cells according to CD27, IgD, IgM, CD24, and CD38 expression by FLOWSOM clustering (cells colored according to IL-10 expression, light blue = double negative, red = positive). P values: P > .05 (ns), P < .05 (*), P < .01 (**), P < .001 (***).
