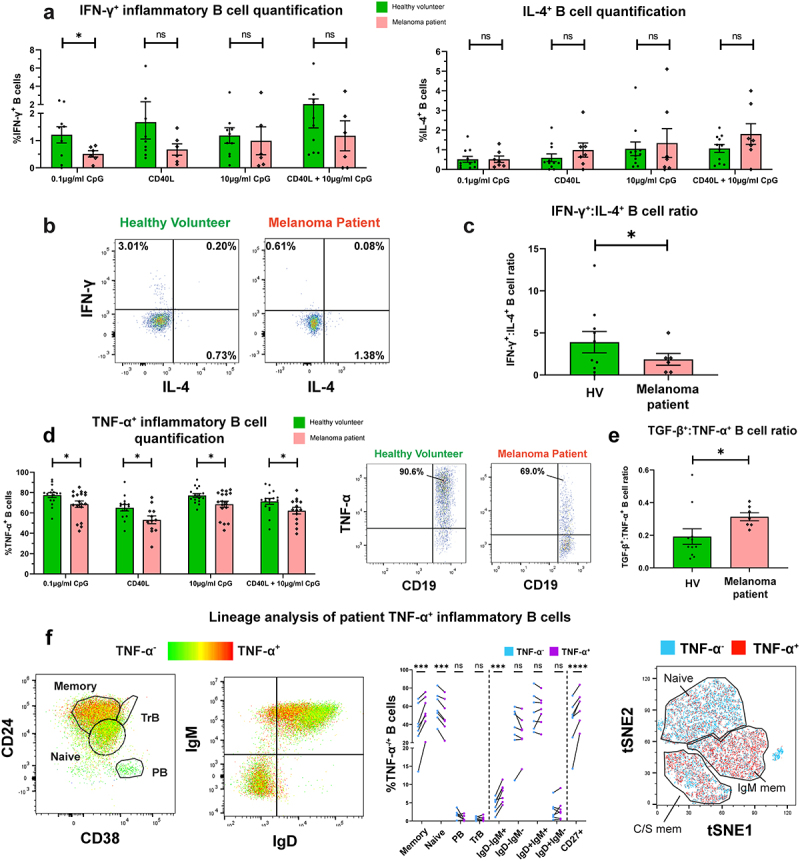
Figure 2.

IFN-γ+ and TNF-α+ B cells are significantly downregulated in melanoma compared to healthy volunteer blood, and patient TNF-α+ B cells show preference for CD27+ memory B cell phenotypes.
(a) Comparison of % IFN-γ-expressing [left] and IL-4-expressing [right] B cells in melanoma patients (N = 6/7 respectively) and matched healthy volunteers (N = 10/12 respectively) following 72-hour culture with B cell activation stimuli (0.1 µg/ml CpG, CD40L, 10 µg/ml CpG, or CD40L + 10 µg/ml CpG). (b) Flow cytometry plots of IFN-γ and IL-4 expression by CD19+ B cells from representative healthy volunteer and melanoma patient (0.1 µg/ml CpG). (c) Ratio of IFN-γ+:IL-4+ B cells in melanoma patients (N = 6) and matched healthy volunteers (N = 10) following stimulation with 0.1 µg/ml CpG. (d) [Left] Comparison of % TNF-α-expressing B cells in melanoma patients (N = 17) and matched healthy volunteers (N = 18) following 72-h culture with stimuli (0.1 µg/ml CpG, CD40L, 10 µg/ml CpG, or CD40L + 10 µg/ml CpG). [Right] Flow cytometry plots of TNF-α+CD19+ B cells from a representative healthy volunteer and melanoma patient (0.1 µg/ml CpG). (e) Ratio of TGF-β+:TNF-α+ B cells in melanoma patients (N = 7) and matched healthy volunteers (N = 11). TNF-α expression was detected following B cell activation with 0.1 µg/ml CpG. (f) TNF-α+ lineage analyses of live single CD19+ B cells from melanoma patient blood. [Left] Flow cytometry plots of B cell lineage and immunoglobulin isotype distribution in a representative patient (cells colored according to TNF-α expression: green = low; red = high). [Middle] Lineage analysis of B cells by TNF-α expression (N = 7). [Right] tSNE projections cluster B cells according to CD27, IgD, IgM, CD24, and CD38 expression using FLOWSOM clustering (cells colored according to TNF-α expression: light blue = double negative, red = positive). P values: P > .05 (ns), P < .05 (*), P < .001 (***), P < .0001 (****).
