Figure 3.

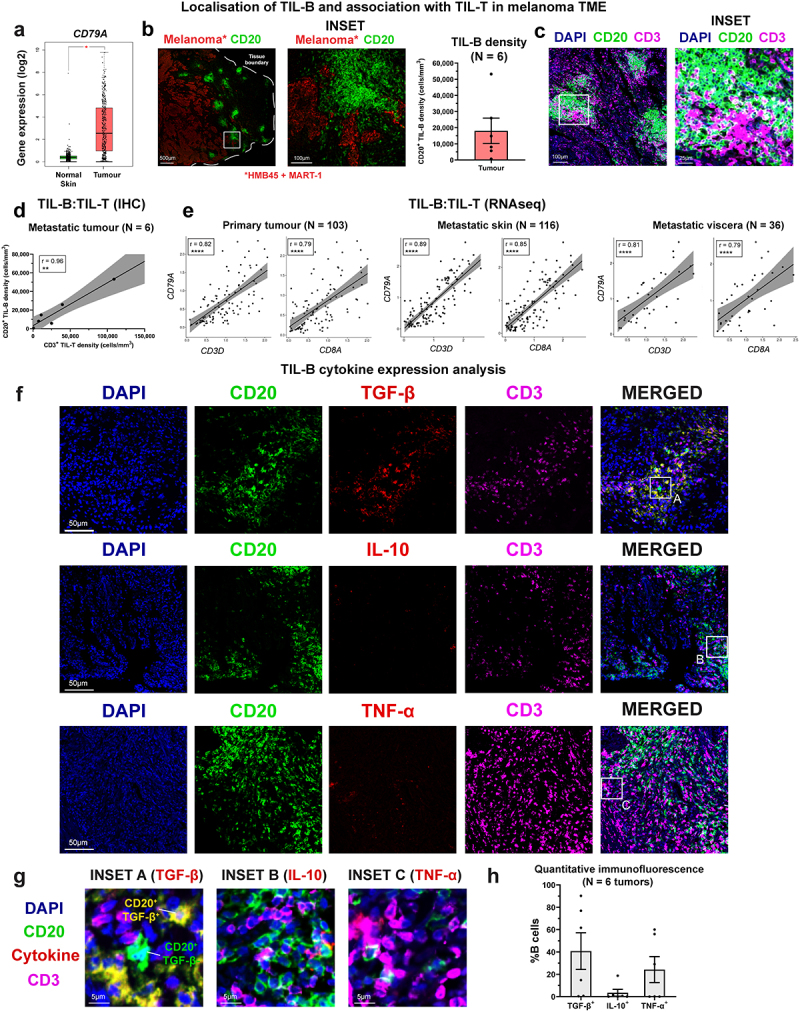
Prevalent TGF-β-expressing Bregs and rare TNF-α-expressing inflammatory B cells in melanoma lesions.
(a) [Left] Comparison of CD79A gene expression within N = 461 melanoma lesion samples and N = 558 normal skin tissues. The pan-B cell marker is significantly elevated in tumors. (b) [Left and middle] Example immunofluorescence images depicting the presence of CD20+ B cell clusters (green) adjacent to melanoma tumor islets (red). CD20; green, melanoma (HMB45 + MART-1); red. Scale bar = 500 µm (main image) and 100 µm (inset). [Right] Quantification of CD20+ TIL-B density in N = 6 melanoma tumors. (c) Example immunofluorescence images depicting clustering of CD20+ B cells (green) with CD3+ T cells within the melanoma TME. DAPI; blue, CD20; green, CD3; purple. Scale bar = 100 µm (main image) and 25 µm (inset). (d) CD20+ TIL-B and CD3+ TIL-T densities measured from N = 6 melanoma tumors show positive correlation (r = 0.96). (e) TIL-B (CD79A+) positively correlate with TIL-T (CD3D+), and TIL-cytotoxic T (CD8A+), analyzed by bulk RNA-seq gene expression (TCGA cohort) across cancer settings (primary, metastatic skin, and metastatic viscera). Spearman’s rank correlation test was used to calculate correlation coefficients (r) and p-values. (f-g) Example immunofluorescence images demonstrate strong presence of CD20+TGF-β+ Bregs (top row; yellow) within a melanoma tumor section, while limited presence of CD20+IL-10+ and TNF-α+ B cells was observed. DAPI; blue, CD20; green, TGF-β/IL-10/TNF-α; red, CD3; purple. Scale bar = 50 µm (panel images) and 10 µm (inset images). (h) Quantitative immunofluorescence (IF) analysis of cytokine expression among TIL-Bs from N = 6 tumor lesions. Percentages of TGF-β+, IL-10+, and TNF-α+ cells were measured among the B cell infiltrate. P values: P < .05 (*), P < .01 (**), P < .0001 (****).
