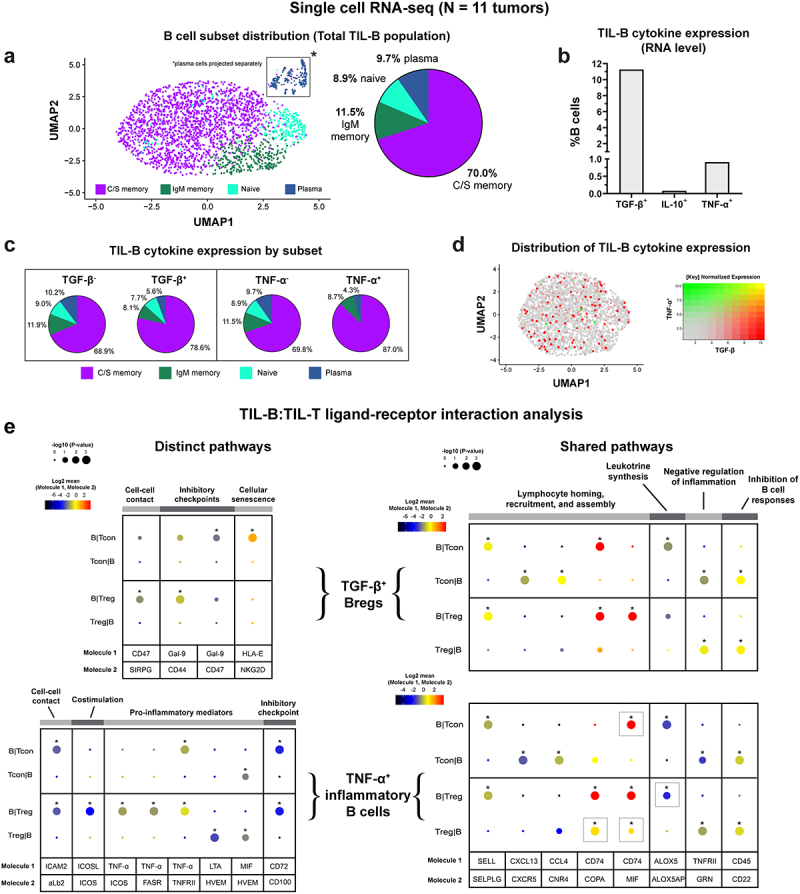
Figure 4.

TGF-β and TNF-α-expressing B cells engage in functional crosstalk with Tcon and Treg cells in the TME.
(a) [Left] UMAP visualization defined by global GEx of single melanoma TIL-B pooled from N = 11 patients (2529 cells), highlighting distribution of major B cell subsets (C/S memory, IgM memory, naïve, and plasma cells). [Right] Pie chart illustrates the proportions of major B cell subsets among melanoma TIL-B. (b) Proportions of melanoma TIL-B expressing TGF-β, IL-10, and TNF-α. (c) Lineage analysis of melanoma TIL-B by cytokine expression. Pie charts compare lineage phenotypes of B cells expressing each of TGF-β [left panel], and TNF-α [right panels], to baseline phenotype (denoted as cytokine− cells) to identify phenotypic preference. TGF-β and TNF-α-expressing TIL-B show a preference toward class-switched memory phenotypes. (d) UMAP visualization of melanoma TIL-B, colored by relative normalized gene expression levels for TGF-β and TNF-α. (e) CellPhoneDB analysis of TGF-β+ [top] and TNF-α+ [bottom] B cell:T cell communication pathways in the TME. T cells were divided into conventional (Tcon) and regulatory (Treg) subsets. [Left] TGF-β+ and TNF-α+ B cell subsets were found to engage in distinct cell–cell contact and inhibitory checkpoint interactions with T cells, while TNF-α+ B cells also engaged in co-stimulation and TNF-α signaling via ICOS, FasR, and TNFRII. [Right] Shared interactions (identical ligand:receptor pairs) for both B cell subsets include lymphoid homing, recruitment, and assembly, leukotriene synthesis, negative regulation of inflammation, and inhibition of B cell responses. Square gray boxes indicate where the shared pathway interactions differ between TGF-β+ and TNF-α+ B cell subsets. Significance was detected after the false discovery rate (FDR<0.001) correction. Circle sizes indicate that p-values and color-coding represents the average expression level of interacting molecule 1 in cluster 1 and interacting molecule 2 in cluster 2.
