Figure 6.

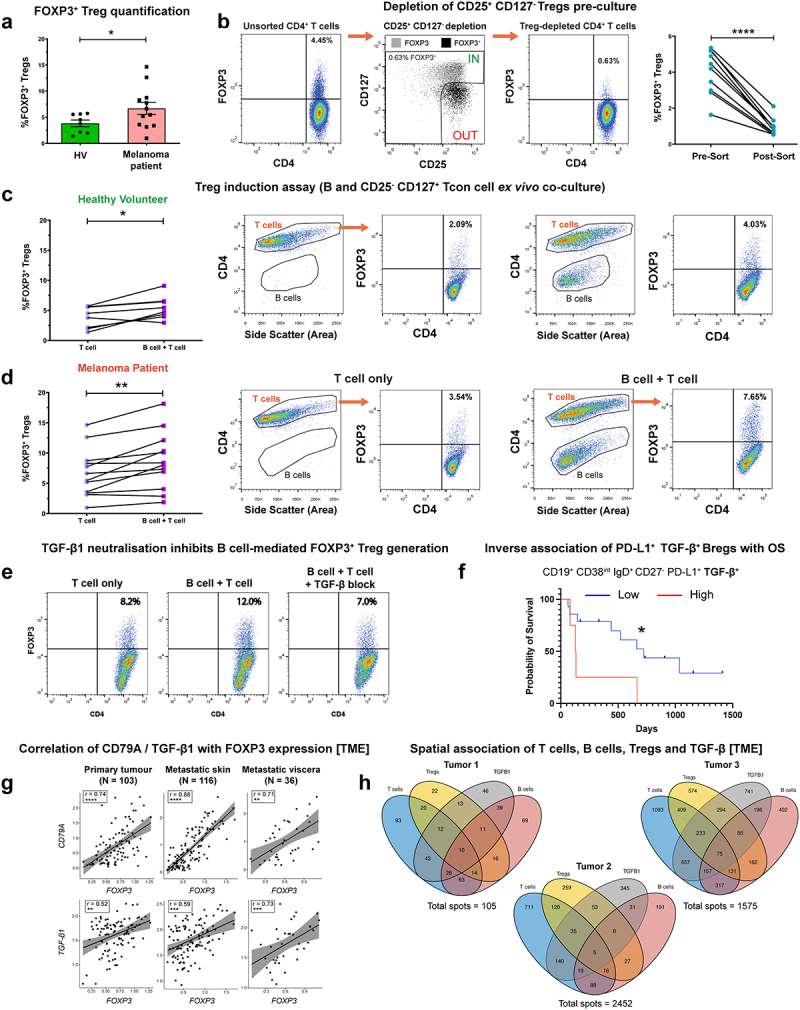
B cells derived from melanoma patient peripheral blood promote a FOXP3+ Treg phenotype from CD25−/int CD127+ conventional T cells.
(a) The % of FOXP3+ Tregs are elevated in melanoma patients (N = 12) compared to healthy volunteers (N = 8), following anti-CD3/CD28 stimulation. (b) [Left] Cell-sorting strategy for the depletion of CD25+CD127− Tregs from peripheral blood CD4+ T cells. [Right] FOXP3-expressing Tregs are successfully depleted following cell sorting (N = 10). (c-d) B cells isolated from healthy volunteers (N = 8) (c) and melanoma patients (N = 12) (d) peripheral blood promoted FOXP3+ Treg differentiation from CD4+CD25−/intCD127+ cells following ex vivo co-culture. Representative flow cytometry plots indicate % of FOXP3-expressing T-helper cells in “T cell only” vs “B cell + T cell” conditions. (e) Representative flow cytometry plots showing that antibody-mediated neutralization of TGF-β alleviates B cell-facilitated induction of FOXP3+ Tregs from CD4+CD25−/intCD127+ Tcon cells. (f) The presence of peripheral blood CD19+CD38intIgD+CD27−PD-L1+TGF-β+ naïve Bregs is associated with decreased probability of overall survival. Patients (N = 18) split by %PD-L1+TGF-β+ naïve Bregs into high (top quartile) and low (below top quartile) groups. (g) CD79A [top] and TGF-β [bottom] gene expression positively correlate with FOXP3, analyzed by bulk RNA-seq gene expression (TCGA cohort) across cancer settings (primary, metastatic skin, and metastatic viscera). Spearman’s rank correlation test was used to calculate correlation coefficients (r) and p-values. (h) Spatial transcriptomics analysis identifies the colocalization of T cells, B cells, Tregs, and TGF-β1 in three melanoma tumor specimens. 9.5% (tumor 1; 10/105), 0.2% (tumor 2; 5/2452), and 4.8% (tumor 3; 75/1575) of spots showed T cells, Tregs, B cells, and presence of TGF-β1. P values: P < .05 (*), P < .01 (**), P < .001 (***) P < .0001 (****).
