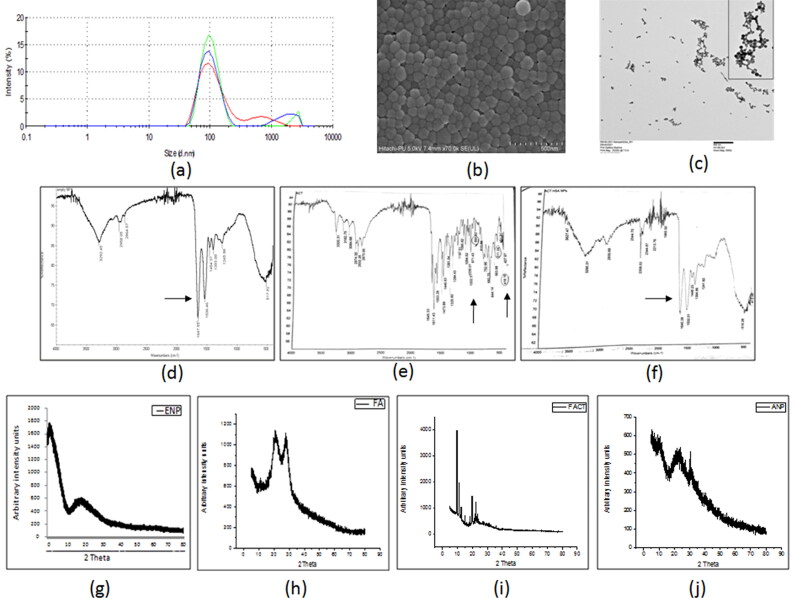
Figure 1.
The characterization of developed actinonin nanoparticles. (a) Representative size distribution of actinonin nanoparticles. The three independent formulations are represented in three different colors. (b)Scanning electron microscopic images of actinonin nanoparticles at 70k X magnification. (c) Transmission electron microscopic image of folate conjugated actinonin nanoparticles. The FTIR data of (d) empty HSA nanoparticles, (e) free actinonin, (f) actinonin nanoparticles. The x-ray diffraction analysis of free drugs and nanoformulated drugs. (g) ENP-empty nanoparticles without folate, (h) FA-folic acid-NHS conjugate, (i) F ACT- free actinonin, (j) ANP- actinonin nanoparticles, The y-axis shows the arbitrary intensity units and x-axis – 2θ˚ (angle in degrees). The experiments were performed in triplicate.

