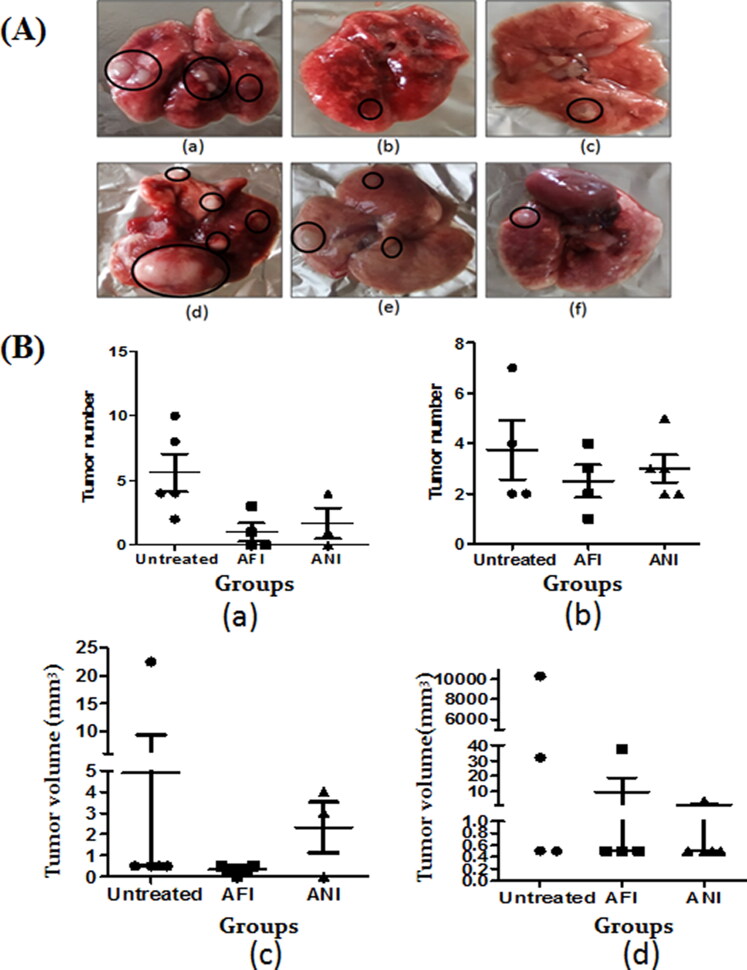
Figure 4.
Gross lung analysis. (A) Representative gross lung tumor lesions of (a) untreated group; (b) free actinonin-treated group; (c) nanoformulated actinonin-treated group; at 6 months latency period. Representative gross lung tumors of (d) untreated group; (e) free actinonin-treated group; (f) nanoformulated actinonin-treated group at 10 months latency period. (B) The tumor number for (a) 6 months latency period groups and (b) 10 months latency period groups. The tumor volume for (c) 6 months latency period groups and (d) 10 months latency period groups. UT – untreated, AFI – free actinonin i.p and ANI – nanoformulated actinonin i.p. Circles highlight the tumor lesions. Values are mean ± S.E. of 3–5 animals.

